Exploratory Data Analytics: Unveiling Insights Hidden in Data
In the realm of data science, exploratory data analytics plays a crucial role in uncovering valuable insights and patterns hidden within datasets. This process involves examining and visualising data to gain a deeper understanding of its characteristics and relationships.
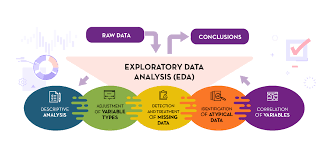
Exploratory data analytics serves as the foundation for more advanced analyses and modeling techniques. By exploring the data visually through graphs, charts, and summary statistics, data scientists can identify trends, outliers, correlations, and other key features that inform subsequent analyses.
One of the primary goals of exploratory data analytics is to detect anomalies or errors in the data that may impact the accuracy of any conclusions drawn from it. By thoroughly exploring the dataset, researchers can clean and preprocess the data effectively to ensure its quality before proceeding with further analysis.
Moreover, exploratory data analytics enables researchers to formulate hypotheses and test assumptions about the relationships between variables. By visualising the data in different ways and conducting statistical tests, analysts can validate their hypotheses and make informed decisions based on evidence.
Overall, exploratory data analytics is a powerful tool that empowers data scientists to extract meaningful insights from complex datasets. By delving deep into the data through visualisation and analysis, researchers can unlock hidden patterns and trends that drive informed decision-making across various domains.
Eight Essential Tips for Effective Exploratory Data Analysis
- 1. Start by understanding the context and objectives of the analysis.
- 2. Cleanse and preprocess the data to ensure accuracy and reliability.
- 3. Use visualisation techniques like histograms, scatter plots, and box plots to explore data distributions.
- 4. Identify outliers and anomalies that may affect the analysis results.
- 5. Perform statistical summaries such as mean, median, mode, standard deviation, etc., to gain insights into the data.
- 6. Explore relationships between variables using correlation analysis or regression models.
- 7. Consider using clustering algorithms to discover patterns within the data.
- 8. Document your findings and insights for better communication and future reference.
1. Start by understanding the context and objectives of the analysis.
When embarking on exploratory data analytics, it is essential to begin by comprehensively understanding the context and objectives of the analysis. By clarifying the purpose and goals of the data exploration process, researchers can tailor their approach to uncovering insights that are aligned with the desired outcomes. Understanding the context helps in framing relevant questions, selecting appropriate variables for analysis, and determining the most suitable methods for exploring the data effectively. This initial step sets a solid foundation for a structured and focused exploration that leads to meaningful discoveries and actionable insights derived from the dataset.
2. Cleanse and preprocess the data to ensure accuracy and reliability.
In the realm of exploratory data analytics, a crucial step is to cleanse and preprocess the data to guarantee its accuracy and reliability. By identifying and rectifying anomalies, errors, and missing values in the dataset, researchers can ensure that the data is of high quality before delving into further analysis. This process not only enhances the integrity of the findings but also lays a solid foundation for uncovering meaningful insights and patterns hidden within the data.
3. Use visualisation techniques like histograms, scatter plots, and box plots to explore data distributions.
When delving into exploratory data analytics, it is essential to utilise visualisation techniques such as histograms, scatter plots, and box plots to delve into data distributions. By leveraging these visual tools, researchers can gain a comprehensive understanding of how data points are distributed across different variables. Histograms provide a visual representation of the frequency distribution of numerical data, while scatter plots reveal relationships between two variables. Additionally, box plots offer insights into the spread and central tendency of the data. Incorporating these visualisation techniques enhances the exploration process and enables researchers to uncover valuable insights hidden within the dataset’s distributions.
4. Identify outliers and anomalies that may affect the analysis results.
In the realm of exploratory data analytics, it is crucial to identify outliers and anomalies that have the potential to significantly impact the results of the analysis. By detecting these irregularities in the dataset, data scientists can ensure the accuracy and reliability of their findings. Outliers may skew statistical measures and distort patterns, leading to misleading conclusions. Therefore, thorough examination and handling of outliers are essential steps in the exploratory data analysis process to guarantee robust and trustworthy results.
5. Perform statistical summaries such as mean, median, mode, standard deviation, etc., to gain insights into the data.
In the realm of exploratory data analytics, a crucial tip is to perform statistical summaries such as mean, median, mode, standard deviation, and other key metrics. These statistical measures provide valuable insights into the central tendencies, dispersion, and distribution of the data. By calculating these summary statistics, data analysts can gain a deeper understanding of the dataset’s characteristics and identify any patterns or outliers that may influence further analysis. Statistical summaries play a vital role in uncovering hidden trends and relationships within the data, guiding researchers towards more informed decision-making and hypothesis testing.
6. Explore relationships between variables using correlation analysis or regression models.
In the realm of exploratory data analytics, it is essential to delve into the relationships between variables to uncover valuable insights. One effective way to achieve this is through correlation analysis or regression models. By examining how variables are related to each other, data scientists can identify patterns, dependencies, and predictive relationships within the dataset. Correlation analysis helps quantify the strength and direction of relationships between variables, while regression models provide a framework for understanding how one variable influences another. By exploring these relationships, researchers can gain a deeper understanding of the underlying dynamics within the data and make informed decisions based on these findings.
7. Consider using clustering algorithms to discover patterns within the data.
When conducting exploratory data analytics, it is beneficial to consider utilising clustering algorithms as a valuable tool to uncover patterns within the dataset. By applying clustering algorithms, data scientists can group similar data points together based on their characteristics or features, thereby revealing underlying structures and relationships within the data. This approach can help identify distinct clusters or segments within the dataset, providing valuable insights into patterns and trends that may not be immediately apparent through traditional analysis methods. Clustering algorithms offer a powerful way to explore complex datasets and extract meaningful information that can inform further analysis and decision-making processes.
8. Document your findings and insights for better communication and future reference.
Documenting your findings and insights in exploratory data analytics is essential for effective communication and future reference. By documenting the key outcomes of your analysis, you create a valuable resource that can be shared with colleagues, stakeholders, or future researchers. Clear documentation not only helps in conveying your findings accurately but also ensures that your insights are preserved for future reference. This practice facilitates collaboration, enables reproducibility of results, and enhances the overall transparency of your data analysis process. Therefore, taking the time to document your findings ensures that the knowledge gained from exploratory data analytics is well-documented and can be utilised for informed decision-making and further research endeavours.
No Responses