Exploratory Statistics: Unveiling Insights from Data
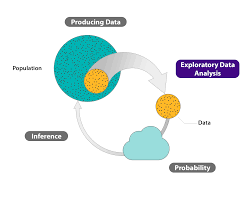
Exploratory statistics is a crucial first step in the data analysis process. It involves investigating and summarising data to gain initial insights and identify patterns that can guide further analysis.
One of the key techniques used in exploratory statistics is data visualization. By creating charts, graphs, and plots, statisticians can visually represent the data distribution, relationships between variables, and any outliers or trends present in the dataset.
Descriptive statistics are also commonly employed in exploratory analysis. Measures such as mean, median, mode, standard deviation, and range provide a summary of the central tendency and dispersion of the data, helping analysts understand its basic characteristics.
Through exploratory statistics, researchers can uncover hidden patterns, detect anomalies, and formulate hypotheses for more advanced statistical tests. It serves as a foundation for further analysis, hypothesis testing, and model building.
By exploring data through statistical methods, analysts can make informed decisions, generate new research questions, and ultimately extract valuable insights that drive evidence-based decision-making across various domains.
Exploratory statistics plays a vital role in modern data science and research practices by unlocking the potential of raw data to reveal meaningful information that can inform strategies, policies, and innovations.
Understanding Exploratory Statistics: Key Questions and Concepts Explained
- What does exploratory mean in statistics?
- What is an example of exploratory data analysis?
- What is the difference between descriptive and exploratory statistics?
- What is exploratory data analysis example?
- What is exploratory vs inferential statistics?
- What is exploratory and descriptive statistics?
What does exploratory mean in statistics?
In the context of statistics, the term “exploratory” refers to the preliminary analysis and investigation of data to uncover patterns, relationships, and insights without making definitive conclusions or hypotheses. Exploratory statistics involves techniques such as data visualization, descriptive statistics, and data mining to gain a deeper understanding of the dataset and identify potential trends or outliers that may guide further analysis. It serves as a crucial step in the data analysis process, helping researchers formulate hypotheses, generate research questions, and make informed decisions based on initial observations before conducting more rigorous statistical tests.
What is an example of exploratory data analysis?
An example of exploratory data analysis is examining the relationship between a company’s advertising expenditure and its sales performance. By collecting data on the amount spent on different advertising channels (such as TV, online, and print) and the corresponding sales figures, analysts can visually represent this relationship through scatter plots or correlation analysis. This exploratory approach helps identify any potential patterns or trends between advertising investment and sales outcomes, providing a preliminary understanding that can guide further in-depth statistical analysis and decision-making processes.
What is the difference between descriptive and exploratory statistics?
Descriptive statistics and exploratory statistics are two essential branches of statistical analysis that serve distinct purposes. Descriptive statistics focus on summarising and presenting data in a meaningful way, using measures such as mean, median, mode, and standard deviation to describe the central tendency and dispersion of a dataset. On the other hand, exploratory statistics involve delving deeper into the data to uncover patterns, relationships, and trends that may not be immediately apparent. Exploratory statistics often utilise data visualization techniques and more advanced statistical methods to identify outliers, detect correlations between variables, and generate hypotheses for further analysis. While descriptive statistics provide a snapshot of the data’s characteristics, exploratory statistics aim to explore the underlying structure of the data and guide subsequent analytical processes.
What is exploratory data analysis example?
Exploratory data analysis involves various techniques to gain initial insights into a dataset before formal statistical testing. An example of exploratory data analysis could be examining the distribution of a variable using histograms or box plots to understand its central tendency and spread. Another example is creating scatter plots to investigate relationships between two variables and identify potential correlations or patterns. By visually exploring the data through these examples, researchers can uncover trends, outliers, and potential areas for further investigation, setting the stage for more in-depth statistical analysis and hypothesis testing.
What is exploratory vs inferential statistics?
In the realm of statistics, exploratory statistics and inferential statistics serve distinct yet complementary purposes. Exploratory statistics focuses on examining and visualizing data to uncover patterns, trends, and relationships without making formal conclusions or inferences about a population. On the other hand, inferential statistics involves using sample data to draw conclusions or make predictions about a larger population. While exploratory statistics is primarily concerned with understanding the data at hand and generating hypotheses for further investigation, inferential statistics aims to generalise findings from a sample to a broader population through statistical inference techniques. Both approaches are essential in statistical analysis, with exploratory statistics laying the groundwork for deeper insights that can be tested and validated through inferential methods.
What is exploratory and descriptive statistics?
Exploratory statistics involves the initial exploration and analysis of data to uncover patterns, trends, and relationships that can guide further investigation. It focuses on visualizing data through graphs and charts, as well as summarizing key characteristics using descriptive statistics such as mean, median, and standard deviation. On the other hand, descriptive statistics provides a summary of the basic features of the dataset, offering insights into its central tendency and variability. While exploratory statistics aims to discover new information and formulate hypotheses for more in-depth analysis, descriptive statistics summarises and describes the data in a clear and concise manner. Together, these two branches of statistical analysis play a fundamental role in understanding data and deriving meaningful conclusions from it.

No Responses