Python and Data Analytics Python has emerged as a powerful tool in the field of data analytics, revolutionizing the way data is processed, analysed, and visualized. Its versatility, simplicity, and vast array of libraries make it a popular choice among data scientists and analysts. One of the key advantages of using Python for data analytics […]
The Power of Python for Data Science: A Coursera Course Python has become a staple in the world of data science, thanks to its versatility and powerful libraries. If you’re looking to enhance your data science skills, the Python for Data Science course on Coursera is a must-try. Designed for beginners and experienced professionals alike, […]
Python for Data Science at IBM Python for Data Science at IBM Python has become a popular programming language in the field of data science, and IBM offers comprehensive courses to help professionals master Python for data analysis and machine learning. IBM’s Python for Data Science courses cover a wide range of topics, including data […]
Categories:
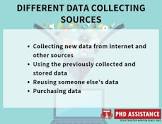
Data Collection and Analysis: Unveiling Insights and Driving Decision-Making In today’s data-driven world, the collection and analysis of data have become crucial for organizations across industries. Whether it’s a small business or a multinational corporation, harnessing the power of data can provide valuable insights, improve operational efficiency, and drive informed decision-making. Data collection is the […]