Data Analysis Methods: Unveiling Insights from Information
In today’s data-driven world, the ability to extract valuable insights from vast amounts of information is paramount. This is where data analysis methods come into play. By employing various techniques and tools, analysts can uncover patterns, trends, and correlations that can drive informed decision-making and spur innovation across industries.
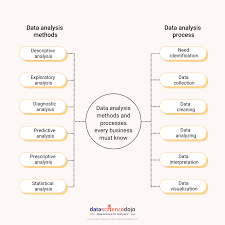
Data analysis methods encompass a wide range of approaches, each tailored to different types of data and research objectives. Let’s explore some commonly used methods:
- Descriptive Analysis: This method involves summarizing and visualizing data to gain a comprehensive understanding of its characteristics. Techniques such as histograms, pie charts, and summary statistics provide a snapshot of the dataset’s central tendencies, distributions, and relationships.
- Inferential Analysis: This method allows analysts to draw conclusions about a population based on a sample dataset. Hypothesis testing, confidence intervals, and regression analysis are commonly employed inferential techniques that help make predictions or generalizations about larger populations.
- Exploratory Data Analysis (EDA): EDA aims to uncover patterns or relationships in the data through visualization and statistical summaries. By examining variables’ distributions and identifying outliers or missing values, analysts can detect potential issues or opportunities for further investigation.
- Predictive Analytics: This method uses historical data to build models that forecast future outcomes or behaviors. Techniques like regression analysis, time series analysis, and machine learning algorithms enable analysts to develop predictive models that assist in forecasting sales trends, customer behavior patterns, or market demand.
- Text Mining: With the exponential growth of unstructured textual data (emails, social media posts, customer reviews), text mining techniques have become essential for extracting valuable insights from text-based sources. Natural Language Processing (NLP), sentiment analysis, topic modeling are some examples of text mining methods used to analyze large volumes of textual data.
- Cluster Analysis: This method groups similar observations together based on their characteristics or attributes. It helps identify distinct segments within a dataset, enabling targeted marketing strategies, customer segmentation, and anomaly detection.
- Network Analysis: Network analysis focuses on the relationships between entities or nodes in a network. By examining connections and interactions, analysts can uncover hidden patterns, influence dynamics, and identify key players in social networks, transportation systems, or financial networks.
- Time Series Analysis: This method analyzes data collected over time to identify patterns and trends. It is widely used in finance, economics, weather forecasting, and other fields where temporal dependencies are critical for decision-making.
It’s important to note that these methods are not mutually exclusive but rather complementary. Often, a combination of techniques is required to gain a holistic understanding of complex datasets.
In conclusion, data analysis methods provide the means to unlock valuable insights from raw data. By applying these techniques appropriately and interpreting the results accurately, businesses can make informed decisions that drive growth and innovation. As technology advances and data continues to grow exponentially, mastering these methods becomes increasingly crucial for organizations seeking a competitive edge in today’s data-driven landscape.
7 Frequently Asked Questions about Data Analysis Methods in English (UK)
- What data analysis methods are available?
- How do I choose the right data analysis method for my project?
- What is the difference between qualitative and quantitative data analysis?
- How can I learn to use different data analysis methods?
- How can I interpret the results of a data analysis method?
- What tools do I need to perform data analysis effectively?
- Is it possible to automate certain aspects of data analysis?
What data analysis methods are available?
There are numerous data analysis methods available, each designed to address specific research objectives and data types. Here are some commonly used methods:
- Descriptive Analysis: Summarizes and visualizes data to understand its characteristics. Techniques include histograms, pie charts, summary statistics, and data visualization.
- Inferential Analysis: Draws conclusions about a population based on a sample dataset. Techniques include hypothesis testing, confidence intervals, and regression analysis.
- Exploratory Data Analysis (EDA): Uncovers patterns or relationships in the data through visualization and statistical summaries. EDA helps identify outliers, missing values, and potential issues.
- Predictive Analytics: Uses historical data to build models that forecast future outcomes or behaviors. Techniques include regression analysis, time series analysis, and machine learning algorithms.
- Text Mining: Extracts insights from unstructured textual data using techniques such as Natural Language Processing (NLP), sentiment analysis, topic modeling, and text classification.
- Cluster Analysis: Groups similar observations together based on their characteristics or attributes. It helps identify distinct segments within a dataset for targeted strategies or anomaly detection.
- Network Analysis: Analyzes relationships between entities in a network to uncover patterns and dynamics using techniques like social network analysis or graph theory.
- Time Series Analysis: Analyzes data collected over time to identify patterns and trends using techniques such as autoregressive integrated moving average (ARIMA) models or exponential smoothing.
- Regression Analysis: Examines the relationship between dependent and independent variables to understand how changes in one variable affect another.
- Factor Analysis: Reduces a large number of variables into a smaller set of underlying factors that explain the observed patterns in the data.
- Survival Analysis: Analyzes time-to-event data to estimate survival probabilities or hazard rates using techniques like Kaplan-Meier estimation or Cox proportional hazards models.
- Decision Trees: Constructs a tree-like model of decisions and their possible consequences to aid decision-making or classification tasks.
These are just a few examples of data analysis methods available. The choice of method depends on the research question, data type, and desired outcomes. It’s important to select the most appropriate method(s) based on the specific context and objectives of the analysis.
How do I choose the right data analysis method for my project?
Choosing the right data analysis method for your project requires careful consideration of several factors. Here are some steps to help guide you in making an informed decision:
- Clearly define your research objectives: Start by understanding the specific goals of your project. What questions are you trying to answer? What insights are you seeking to gain from the data? Defining clear objectives will help narrow down the appropriate analysis methods.
- Understand your data: Gain a thorough understanding of the type, structure, and quality of your data. Is it numerical, categorical, or textual? Is it structured or unstructured? Are there any missing values or outliers? Understanding these characteristics will help determine which analysis methods are suitable for your dataset.
- Consider the nature of your variables: Analyze the variables in your dataset and determine their measurement scales (nominal, ordinal, interval, ratio). This information will guide you in selecting appropriate statistical techniques that align with the nature of your variables.
- Evaluate assumptions and requirements: Different analysis methods have specific assumptions and requirements that need to be met for accurate results. For example, linear regression assumes a linear relationship between variables and normality of residuals. Ensure that your data meets these assumptions before choosing a particular method.
- Consider sample size and representativeness: The size and representativeness of your sample can influence the choice of analysis methods. Small samples may limit the use of certain techniques, while representative samples are crucial for generalization in inferential analysis.
- Seek expert advice: If you are unsure about which method to choose or lack expertise in a particular area, consider consulting with experts or statisticians who can provide guidance based on their domain knowledge and experience.
- Explore literature and case studies: Research similar projects or studies that have tackled similar research questions or datasets. Understanding how others have approached similar analyses can provide valuable insights into suitable methods.
- Experiment and iterate: Sometimes, it may be necessary to try different analysis methods or combinations of methods to find the most appropriate approach. Don’t be afraid to experiment and iterate until you find the method that best aligns with your project objectives.
Remember, the choice of data analysis method is not a one-size-fits-all approach. It requires careful consideration of your project’s specific requirements, data characteristics, and research objectives. By following these steps and seeking expert advice when needed, you can make an informed decision that will lead to meaningful insights from your data.
What is the difference between qualitative and quantitative data analysis?
Qualitative and quantitative data analysis are two distinct approaches used to analyze data, each with its own characteristics and purposes. Here are the key differences between the two:
Quantitative Data Analysis:
Nature of Data: Quantitative analysis deals with numerical data, such as measurements, counts, or ratings that can be expressed in numerical terms.
Objective: The primary goal of quantitative analysis is to quantify relationships, patterns, and trends in the data using statistical methods.
Sample Size: Quantitative analysis often requires larger sample sizes to ensure statistical validity and representativeness.
Statistical Techniques: This approach employs statistical techniques such as regression analysis, hypothesis testing, and descriptive statistics to analyze the data.
Generalizability: Quantitative analysis aims to generalize findings from a sample population to a larger population by using probability-based sampling methods.
Objectivity: It emphasizes objectivity by minimizing researcher bias through standardized procedures and statistical tests.
Qualitative Data Analysis:
Nature of Data: Qualitative analysis deals with non-numerical data, such as interviews, observations, or open-ended survey responses that provide rich descriptive information.
Objective: The primary goal of qualitative analysis is to interpret and understand the meanings, themes, and patterns within the data in a subjective manner.
Sample Size: Qualitative analysis often involves smaller sample sizes due to its focus on in-depth exploration rather than generalizability.
Analytical Techniques: This approach employs techniques like thematic analysis, content analysis, or grounded theory to identify patterns and themes in the data.
Contextual Understanding: Qualitative analysis seeks to understand social contexts, individual perspectives, and subjective experiences surrounding the phenomena under study.
Subjectivity: It recognizes that researchers’ interpretations play a significant role in analyzing qualitative data since it involves subjective judgments and interpretations.
It’s important to note that these approaches are not mutually exclusive but can be used in combination to gain a more comprehensive understanding of a research topic. Quantitative analysis provides numerical insights and statistical generalizability, while qualitative analysis offers rich contextual information and subjective interpretations. The choice between the two depends on the research objectives, the nature of the data, and the questions being addressed.
How can I learn to use different data analysis methods?
Learning to use different data analysis methods can be an exciting and rewarding journey. Here are some steps you can take to enhance your skills in this field:
- Set clear learning objectives: Determine the specific data analysis methods you want to learn and the goals you want to achieve. This will help you focus your efforts and track your progress.
- Gain a solid foundation in statistics: Understanding statistical concepts is crucial for effective data analysis. Familiarize yourself with key topics such as probability, hypothesis testing, regression analysis, and sampling techniques. Online courses, textbooks, or tutorials can provide a structured approach to learning statistics.
- Choose a programming language: Data analysis often involves coding to manipulate and analyze datasets. Popular programming languages for data analysis include Python (with libraries like Pandas, NumPy, and SciPy) and R. Select a language that aligns with your goals and preferences, and start learning its fundamentals.
- Take online courses or attend workshops: There are numerous online platforms that offer comprehensive courses on data analysis methods. Websites like Coursera, edX, DataCamp, and Udemy provide a wide range of courses taught by experienced instructors. Look for courses specifically focused on the methods you want to learn.
- Practice with real-world datasets: Apply your knowledge by working with real-world datasets that align with your interests or industry of choice. This will help you understand how different data analysis methods can be applied in practical scenarios.
- Join online communities and forums: Engage with others who share your interest in data analysis methods through online communities such as Stack Overflow or Reddit’s r/datascience subreddit. Participating in discussions, asking questions, and sharing insights can greatly enhance your learning experience.
- Work on projects: Undertake personal projects where you can apply the data analysis methods you’ve learned to solve specific problems or explore interesting research questions. This hands-on experience will deepen your understanding of the methods and allow you to showcase your skills.
- Seek mentorship or guidance: If possible, connect with professionals in the field of data analysis who can provide guidance and mentorship. They can offer valuable insights, review your work, and suggest improvements.
- Stay updated with industry trends: Data analysis is a rapidly evolving field. Stay informed about new techniques, tools, and best practices by following industry blogs, attending webinars or conferences, and reading relevant books or research papers.
- Practice regularly: Consistency is key to mastering data analysis methods. Set aside dedicated time each week to practice and reinforce your skills. The more you practice, the more confident and proficient you will become.
Remember that learning data analysis methods is an ongoing process. Embrace a growth mindset, be patient with yourself, and enjoy the journey of discovering new insights from data!
How can I interpret the results of a data analysis method?
Interpreting the results of a data analysis method is crucial for deriving meaningful insights and making informed decisions. Here are some general guidelines to help you effectively interpret your data analysis results:
- Understand the context: Before diving into the results, it’s important to have a clear understanding of the research question or objective, the data collection process, and any assumptions made during the analysis. This contextual knowledge will provide a foundation for interpreting the results accurately.
- Examine statistical measures: Look at summary statistics such as mean, median, standard deviation, or correlation coefficients depending on the analysis method used. These measures provide a quantitative understanding of central tendencies, variability, and relationships within the data.
- Consider significance levels: If you have performed hypothesis testing or inferential analysis, pay attention to p-values or confidence intervals. These values indicate the level of confidence in your findings and whether they are statistically significant or merely due to chance.
- Visualize the data: Utilize graphs, charts, or visual representations to gain a better understanding of patterns and trends within your data. Visualizations can help identify outliers, clusters, or relationships that might not be immediately apparent from numerical summaries alone.
- Compare against expectations: Compare your findings against prior knowledge, theoretical expectations, or industry benchmarks if available. This comparison can provide insights into whether your results align with existing theories or if they deviate significantly from what was anticipated.
- Consider limitations and assumptions: Acknowledge any limitations in your data collection process or assumptions made during analysis. Understanding these limitations will help you interpret your results within their appropriate context and avoid overgeneralizing conclusions.
- Seek expert advice if needed: If you encounter complex or unfamiliar results that require deeper expertise in a specific domain or statistical technique, consider consulting with subject matter experts who can provide additional insights and guidance.
- Communicate clearly: When presenting your results to others, ensure that you explain your findings in a clear and concise manner. Avoid jargon and provide appropriate context so that your audience can understand the implications and potential applications of your analysis.
Remember, interpretation is an iterative process that involves critically analyzing the results, considering alternative explanations, and refining your understanding as new insights emerge. By following these guidelines and continuously questioning your findings, you can derive meaningful insights from your data analysis and make informed decisions based on the results.
What tools do I need to perform data analysis effectively?
To perform data analysis effectively, you will need a combination of tools that can handle various aspects of the analysis process. Here are some essential tools commonly used by data analysts:
- Spreadsheet Software: Spreadsheet software like Microsoft Excel or Google Sheets is a fundamental tool for organizing and manipulating data. It allows you to input, clean, and transform data, perform basic calculations, and create visualizations.
- Statistical Software: Dedicated statistical software packages such as R, Python (with libraries like NumPy and Pandas), or SAS provide more advanced statistical analysis capabilities. These tools offer a wide range of functions for data manipulation, hypothesis testing, regression analysis, and more.
- Data Visualization Tools: Tools like Tableau, Power BI, or ggplot in R enable you to create visually appealing charts, graphs, and interactive dashboards to communicate your findings effectively. Visualizations help in understanding patterns and trends within the data.
- SQL (Structured Query Language): SQL is essential when working with relational databases. It allows you to retrieve specific subsets of data using queries and perform operations like filtering, joining tables, aggregating data, etc.
- Programming Languages: Learning programming languages like Python or R can significantly enhance your ability to analyze large datasets efficiently. These languages offer extensive libraries for statistical analysis, machine learning algorithms implementation, and advanced data manipulation.
- Machine Learning Tools: If you are involved in predictive analytics or machine learning tasks, tools like scikit-learn (Python), TensorFlow (Python), or Weka (Java) provide powerful capabilities for building and evaluating predictive models.
- Text Mining Tools: When dealing with text-based datasets or unstructured textual information, tools like Natural Language Processing (NLP) libraries in Python (NLTK) or R (tm package) can assist in processing text data efficiently.
- Data Cleaning Tools: Data cleaning is a critical step before analysis. OpenRefine is a popular tool for cleaning and transforming messy datasets, handling missing values, and standardizing data formats.
- Data Warehousing Tools: For managing large volumes of structured or unstructured data, tools like Apache Hadoop, Apache Spark, or Amazon Redshift can help store and process data efficiently.
- Version Control Systems: Using version control systems like Git allows you to track changes in your analysis code, collaborate with others effectively, and revert to previous versions if needed.
Remember that the choice of tools depends on your specific needs, preferences, and the type of analysis you are conducting. It’s essential to continuously explore new tools and stay updated with the latest advancements in the field to perform data analysis effectively.
Is it possible to automate certain aspects of data analysis?
Yes, it is indeed possible to automate certain aspects of data analysis. With advancements in technology and the rise of artificial intelligence and machine learning, automation has become an integral part of the data analysis process.
Here are some areas where automation can be applied in data analysis:
- Data Cleaning: Cleaning and preprocessing raw data is often a time-consuming task. Automation can help streamline this process by automatically detecting and handling missing values, outliers, and inconsistencies in the dataset.
- Data Integration: When working with multiple datasets from different sources, automating the integration process can save significant time and effort. Automated tools can match and merge datasets based on common variables or use advanced algorithms to combine disparate data sources.
- Data Transformation: Automation can assist in transforming data into different formats or structures required for specific analyses. This includes tasks such as standardizing units of measurement, converting categorical variables into numerical representations, or normalizing data for statistical analysis.
- Pattern Recognition: Machine learning algorithms can automate the identification of patterns, trends, and anomalies within large datasets. These algorithms can analyze vast amounts of data quickly and efficiently to uncover insights that might be challenging for humans to detect manually.
- Predictive Modeling: Automation plays a crucial role in building predictive models by automatically selecting relevant features, tuning model parameters, and evaluating model performance using cross-validation techniques. This enables analysts to develop accurate predictive models without extensive manual trial-and-error iterations.
- Reporting and Visualization: Automation tools can generate automated reports and visualizations based on predefined templates or user-defined specifications. This streamlines the process of communicating insights derived from the data analysis to stakeholders in a clear and concise manner.
It’s important to note that while automation can greatly enhance efficiency in certain aspects of data analysis, human expertise is still essential for interpreting results, making informed decisions based on context-specific knowledge, and ensuring ethical considerations are addressed throughout the process.
By leveraging automation alongside human expertise, organizations can improve the speed, accuracy, and scalability of their data analysis efforts, enabling them to derive valuable insights more efficiently and effectively.
No Responses