Data Analysis Tools and Techniques: Unlocking the Power of Data
In today’s data-driven world, businesses and organizations have access to vast amounts of information. However, without the right tools and techniques, this data becomes nothing more than an overwhelming sea of numbers and figures. That’s where data analysis tools and techniques come into play, empowering us to extract valuable insights and make informed decisions.
Data analysis tools refer to software applications that facilitate the process of organizing, cleaning, transforming, and visualizing data. These tools provide a user-friendly interface that allows analysts to explore large datasets efficiently. Some popular examples include Microsoft Excel, Tableau, Python’s Pandas library, and R programming language.
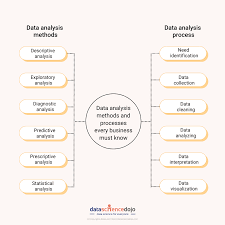
One crucial aspect of data analysis is the ability to identify patterns and trends within the data. This is where various analytical techniques come into play. Let’s explore a few key techniques commonly used in data analysis:
- Descriptive Analysis: This technique involves summarizing and describing the main characteristics of a dataset. It includes measures such as mean, median, mode, standard deviation, and graphical representations like histograms or pie charts. Descriptive analysis provides an initial understanding of the dataset before diving deeper into more complex analyses.
- Inferential Analysis: Inferential analysis involves making predictions or generalizations about a larger population based on a sample dataset. It uses statistical methods such as hypothesis testing and confidence intervals to draw conclusions from limited data.
- Predictive Analysis: Predictive analysis utilizes historical data to forecast future outcomes or trends. Techniques such as regression analysis, time series analysis, and machine learning algorithms are employed to build predictive models that can help organizations anticipate customer behavior or market trends.
- Exploratory Data Analysis (EDA): EDA is an iterative process that involves visualizing and exploring datasets to uncover hidden patterns or relationships between variables. Techniques like scatter plots, box plots, heatmaps, and correlation matrices aid in identifying potential insights or outliers.
- Text Mining and Natural Language Processing (NLP): With the proliferation of unstructured data, text mining and NLP techniques have become essential for extracting meaningful information from text documents. Sentiment analysis, topic modeling, and named entity recognition are some examples of how these techniques are applied to analyze textual data.
- Data Visualization: Visualizing data is crucial for effective communication and understanding of complex information. Tools like interactive dashboards, charts, and graphs help present data in a visually appealing manner, making it easier for stakeholders to grasp insights quickly.
Data analysis tools and techniques enable organizations to derive actionable insights from their data, leading to improved decision-making, enhanced operational efficiency, and a competitive edge. By harnessing the power of these tools and techniques, businesses can identify trends, optimize processes, target specific customer segments, and drive innovation.
However, it’s important to note that selecting the right tools and techniques depends on the nature of the data and the specific goals of the analysis. It requires a combination of domain expertise, statistical knowledge, and familiarity with various software applications.
In conclusion, data analysis tools and techniques play a vital role in transforming raw data into meaningful insights. They empower businesses to make informed decisions based on evidence rather than intuition or guesswork. As technology continues to advance rapidly, so too does our ability to extract valuable knowledge from vast amounts of data. With the right tools at our disposal, we can unlock the true potential of data analysis in driving success across industries.
6 Essential Tips for Effective Data Analysis: Mastering Tools and Techniques
- Utilise the right data analysis tool for the job – different tools are best suited to specific tasks, so make sure you understand your requirements and select the most appropriate tool for your analysis.
- Take advantage of visualisation techniques – graphical representations of data can be extremely useful in understanding trends and patterns within datasets quickly and effectively.
- Automate where possible – use automated processes to speed up repetitive tasks such as data entry or aggregation, allowing more time to focus on analysing results and drawing meaningful conclusions from them.
- Use a variety of methods – combining quantitative techniques with qualitative methods such as interviews or surveys can help provide a more comprehensive view of your dataset in order to draw accurate conclusions from it.
- Make sure you have an adequate sample size – having too few samples may lead to inaccurate results due to lack of statistical power, while too many could result in over-analysis which could lead you away from key insights about your dataset.
- Monitor changes over time – tracking changes in data over time can help identify patterns or trends that would otherwise go unnoticed, giving you valuable insight into how certain variables are affecting each other within your dataset.
Utilise the right data analysis tool for the job – different tools are best suited to specific tasks, so make sure you understand your requirements and select the most appropriate tool for your analysis.
Utilize the Right Data Analysis Tool for the Job: Maximizing Efficiency and Accuracy
In the realm of data analysis, selecting the right tool for the job is crucial. With a wide range of data analysis tools available, it’s important to understand your requirements and choose the most appropriate one for your specific analysis. By doing so, you can maximize efficiency, accuracy, and ultimately derive meaningful insights from your data.
Different data analysis tools are designed with specific tasks in mind. For instance, Microsoft Excel is widely used for basic data manipulation and visualization. Its user-friendly interface makes it accessible to a broad range of users. On the other hand, more advanced tools like Tableau offer powerful visual analytics capabilities that allow for interactive exploration of complex datasets.
When considering which tool to use, it’s essential to assess your requirements. Are you looking to perform statistical analyses? Do you need to handle large datasets? Are you working with structured or unstructured data? Understanding these factors will help guide your decision-making process.
For statistical analyses, tools like R or Python’s Pandas library provide extensive capabilities and a wide range of statistical functions. These tools are highly flexible and allow for in-depth exploration and modeling of data.
If you’re dealing with big data or require advanced analytics techniques such as machine learning algorithms, Apache Spark or Python’s scikit-learn library might be more suitable choices. These tools are designed to handle large-scale datasets efficiently and provide robust machine learning capabilities.
Furthermore, consider whether you need specialized tools for text mining or natural language processing tasks. Tools like NLTK (Natural Language Toolkit) in Python or RapidMiner offer specific functionalities tailored towards analyzing textual data.
By utilizing the right tool for each task, you can streamline your workflow and ensure accurate results. Each tool has its strengths and weaknesses, so taking the time to understand their features will save you from potential roadblocks during analysis.
Additionally, staying updated with advancements in data analysis tools is crucial. New tools and techniques are constantly emerging, offering improved functionalities and efficiency. Keeping yourself informed about these developments can help you stay ahead in your data analysis endeavors.
In conclusion, selecting the most appropriate data analysis tool for your specific requirements is essential for maximizing efficiency and accuracy. By understanding your needs and exploring the features of different tools, you can ensure that you’re equipped with the right resources to extract meaningful insights from your data. So, take the time to assess your needs and choose wisely – it will make a significant difference in the success of your data analysis projects.
Take advantage of visualisation techniques – graphical representations of data can be extremely useful in understanding trends and patterns within datasets quickly and effectively.
Take Advantage of Visualization Techniques: Unveiling Insights through Graphical Representations
In the world of data analysis, visualizing data through graphical representations is a powerful technique that can unlock a wealth of insights. When faced with complex datasets, visualizations offer a clear and intuitive way to understand trends and patterns quickly and effectively.
Graphical representations bring data to life by presenting it in visually appealing formats such as charts, graphs, and interactive dashboards. Here’s why taking advantage of visualization techniques is crucial in the realm of data analysis:
- Spotting Trends at a Glance: Graphical representations allow analysts to identify trends and patterns within datasets rapidly. By plotting data points on line charts or area graphs, for example, it becomes easier to observe fluctuations over time or compare different variables. These visual cues enable analysts to make connections that may not be immediately apparent when examining raw numbers.
- Enhancing Data Exploration: Visualization techniques facilitate exploratory data analysis (EDA). Through scatter plots, box plots, or heatmaps, analysts can visually explore relationships between variables or detect outliers. Visualizations provide an intuitive way to delve into the dataset, uncovering hidden insights and generating hypotheses for further investigation.
- Simplifying Complex Concepts: Data analysis often involves dealing with intricate concepts or statistical models. Visualizations offer a simplified representation of these concepts, making them more accessible to stakeholders who may not have extensive technical knowledge. By distilling complex information into easy-to-understand visuals, analysts can effectively communicate their findings and gain buy-in from decision-makers.
- Facilitating Decision-Making: When it comes to making informed decisions based on data analysis, visualizations are invaluable tools. By presenting key findings in visually compelling formats, decision-makers can grasp the implications quickly and confidently. Whether it’s identifying areas for improvement or showcasing the impact of certain strategies, visualizations provide a compelling narrative that supports decision-making processes.
- Enabling Storytelling: Visualizations have the power to tell stories and convey insights in a captivating manner. By combining different types of visualizations, analysts can weave a narrative that engages stakeholders and fosters a deeper understanding of the data. Storytelling through visualizations enhances the impact of data analysis, ensuring that insights are not only understood but also remembered.
In summary, visualizations are indispensable tools in the realm of data analysis. They enable analysts to uncover trends, explore complex datasets, simplify concepts, facilitate decision-making, and tell compelling stories with data. By leveraging graphical representations effectively, organizations can gain a competitive edge by harnessing the full potential of their data.
So, next time you embark on a data analysis journey, remember to take advantage of visualization techniques. From simple bar charts to interactive dashboards, let visuals guide you through the intricate world of data and unlock valuable insights along the way.
Automate where possible – use automated processes to speed up repetitive tasks such as data entry or aggregation, allowing more time to focus on analysing results and drawing meaningful conclusions from them.
Automate Where Possible: Streamlining Data Analysis with Automation
In the world of data analysis, time is of the essence. The more efficiently we can process and analyze data, the quicker we can uncover valuable insights and make informed decisions. One powerful tip to enhance productivity in data analysis is to automate repetitive tasks using data analysis tools and techniques.
Automation involves leveraging software applications or scripts to perform tasks that would otherwise require manual effort. By automating processes such as data entry, aggregation, cleaning, or transformation, analysts can save significant time and allocate their energy towards analyzing results and drawing meaningful conclusions.
One common example of automation in data analysis is the use of macros or scripts in spreadsheet software like Microsoft Excel. These tools allow analysts to record a series of steps performed on a dataset and replay them at a later stage. For instance, if you frequently import new data into your analysis workbook, you can create a macro that automates this process with just a single click.
Another way to automate repetitive tasks is through programming languages specifically designed for data analysis, such as Python or R. These languages offer libraries and packages that simplify complex operations and allow for efficient manipulation of large datasets. With just a few lines of code, analysts can automate tasks like merging multiple datasets, cleaning messy data, or performing calculations across thousands of rows.
By embracing automation in data analysis, professionals gain several advantages. Firstly, it significantly reduces the risk of human error that often accompanies manual processes. Automating repetitive tasks minimizes the chances of overlooking crucial steps or introducing inaccuracies during data entry.
Secondly, automation saves considerable time by eliminating the need for manual intervention at every step. Instead of spending hours copying and pasting information or performing monotonous calculations by hand, analysts can let automated processes handle these routine activities while they focus on interpreting results and extracting insights from the data.
Furthermore, automation promotes consistency in analyses by ensuring standardized procedures are followed consistently across different datasets or projects. This consistency enhances the reliability and comparability of results, enabling analysts to draw more accurate conclusions and make data-driven decisions with confidence.
However, it’s important to note that not all tasks can be automated effectively. Complex analyses often require human judgment, critical thinking, and domain expertise. Automation should be used judiciously to complement the analytical process rather than replacing it entirely.
In conclusion, automating repetitive tasks in data analysis is a valuable technique that empowers analysts to work more efficiently and effectively. By leveraging automation tools and techniques, professionals can streamline their workflow, reduce errors, and focus on the essential task of extracting meaningful insights from data. Embracing automation is a step towards optimizing productivity in the field of data analysis and unlocking the full potential of available resources.
Use a variety of methods – combining quantitative techniques with qualitative methods such as interviews or surveys can help provide a more comprehensive view of your dataset in order to draw accurate conclusions from it.
Enhancing Data Analysis: The Power of Combining Quantitative and Qualitative Methods
When it comes to data analysis, one of the most valuable tips is to use a variety of methods. While quantitative techniques offer a wealth of statistical insights, they may not always capture the complete picture. By incorporating qualitative methods such as interviews or surveys, analysts can gain a more comprehensive view of their dataset and draw accurate conclusions.
Quantitative analysis involves working with numerical data and applying statistical techniques to identify patterns, trends, and relationships. It provides objective measurements and allows for rigorous analysis. However, quantitative methods alone may overlook important contextual information or fail to capture the nuances and complexities of human experiences.
This is where qualitative methods come into play. Qualitative analysis focuses on gathering non-numerical data through interviews, surveys, observations, or focus groups. It aims to understand the underlying motivations, opinions, attitudes, and behaviors of individuals or groups.
By combining quantitative and qualitative methods, analysts can leverage the strengths of both approaches. Here are some key benefits:
- Contextual Understanding: Qualitative methods provide rich contextual information that helps interpret quantitative findings. They shed light on why certain patterns or trends exist by capturing the perspectives and experiences of individuals involved. This deeper understanding adds depth to the analysis and helps avoid misinterpretation.
- Uncovering Unseen Factors: Quantitative analysis may identify correlations between variables but cannot always explain why they occur. Qualitative methods allow researchers to explore underlying factors that influence these relationships. By conducting interviews or surveys, analysts can uncover hidden insights that might not be apparent through numbers alone.
- Triangulation: Combining different research methods enhances the validity and reliability of findings through triangulation. Triangulation involves comparing results from multiple sources or approaches to validate conclusions drawn from each method independently. This strengthens confidence in the accuracy of the analysis.
- Holistic Insights: Integrating quantitative and qualitative data provides a more holistic view of the dataset. It allows for a comprehensive understanding of complex phenomena, capturing both the numerical trends and the human aspects that influence them. This comprehensive view enables analysts to draw robust and well-rounded conclusions.
However, it is important to note that combining quantitative and qualitative methods requires careful planning and execution. Researchers must ensure the compatibility of data collection methods, maintain consistency in analysis techniques, and effectively integrate findings.
In conclusion, using a variety of methods in data analysis is crucial for gaining a comprehensive understanding of datasets. By combining quantitative techniques with qualitative methods, researchers can obtain a more nuanced perspective, uncover hidden insights, and draw accurate conclusions. Embracing both the objective power of numbers and the subjective richness of human experiences leads to more robust analyses that can inform decision-making with greater clarity and depth.
Make sure you have an adequate sample size – having too few samples may lead to inaccurate results due to lack of statistical power, while too many could result in over-analysis which could lead you away from key insights about your dataset.
The Importance of Sample Size in Data Analysis: Striking the Right Balance
When it comes to data analysis, one crucial aspect that often gets overlooked is the sample size. The size of your sample can significantly impact the accuracy and reliability of your results. It’s important to strike the right balance, as having too few or too many samples can lead to potential pitfalls in your analysis.
Having an adequate sample size is essential because it affects the statistical power of your analysis. Statistical power refers to the ability of a study to detect a true effect or relationship within the dataset. Insufficient sample sizes can result in low statistical power, making it challenging to identify meaningful patterns or draw accurate conclusions from the data.
On one hand, having too few samples may lead to inaccurate results. With a small sample size, there is a higher chance of random variation influencing your findings. This means that any observed relationships or effects might not be representative of the larger population you are studying. In such cases, drawing generalizations or making significant decisions based on limited data could be misleading.
On the other hand, having an excessively large sample size can also pose challenges. Over-analysis becomes a concern when researchers start finding statistically significant results for even trivial relationships within their dataset. This could divert attention away from key insights and lead to wasting resources on analyzing unnecessary details.
So, how do we determine an appropriate sample size? The answer depends on various factors such as the research question, desired level of precision, expected effect size, and available resources. Statistical techniques like power analysis can help estimate the minimum sample size required for detecting meaningful effects with sufficient confidence.
It’s important to note that there is no one-size-fits-all solution for determining sample sizes. Different study designs and analyses may have different requirements. Consulting with statisticians or experts in your field can provide valuable guidance in determining an optimal sample size for your specific research objectives.
In conclusion, ensuring an adequate sample size is a critical consideration in data analysis. It helps improve the reliability and generalizability of your findings. Striking the right balance between too few and too many samples is essential to avoid inaccurate results or over-analysis. By carefully determining an appropriate sample size, researchers can enhance the statistical power of their analysis and uncover meaningful insights that accurately represent the population under study.
Monitor changes over time – tracking changes in data over time can help identify patterns or trends that would otherwise go unnoticed, giving you valuable insight into how certain variables are affecting each other within your dataset.
Monitor Changes Over Time: Unveiling Insights with Data Analysis
In the world of data analysis, one powerful tip that should never be overlooked is the importance of monitoring changes over time. By tracking and analyzing how data evolves over a specific period, we can uncover hidden patterns, trends, and relationships that might otherwise go unnoticed. This valuable insight provides a deeper understanding of how certain variables interact within our dataset.
When we examine data at different points in time, we gain the ability to detect shifts or fluctuations that could be critical for decision-making. Here are a few reasons why monitoring changes over time is an essential technique in data analysis:
- Identifying Trends: Tracking data over time allows us to identify long-term trends or patterns that may not be apparent when looking at individual snapshots. By visualizing data points on a timeline or using statistical methods such as regression analysis, we can spot upward or downward trends, seasonal variations, or cyclical patterns. This information helps businesses make informed predictions and plan accordingly.
- Uncovering Relationships: Changes in one variable often influence other variables within a dataset. By monitoring these changes over time, we can reveal correlations and causal relationships that may exist between different factors. For example, tracking sales figures alongside marketing campaigns can help determine which strategies yield the most significant impact on revenue.
- Detecting Anomalies: Data anomalies can indicate unexpected events or outliers within a dataset. By comparing current data with historical records, we can identify unusual spikes or dips that require further investigation. This helps in identifying potential errors in data collection or uncovering significant events that may have influenced the results.
- Evaluating Interventions: When implementing changes or interventions within an organization, it is crucial to assess their impact over time. By continuously monitoring relevant metrics before and after an intervention, we can evaluate its effectiveness and make informed decisions about its continuation or modification.
To effectively monitor changes over time, it is essential to employ suitable data analysis tools and techniques. Time series analysis, for instance, is a statistical method specifically designed to analyze data collected over regular intervals. This technique helps identify patterns, forecast future values, and understand the underlying dynamics of time-dependent data.
In conclusion, monitoring changes over time is a fundamental aspect of data analysis that should not be underestimated. By tracking variations in data points over a specific period, we gain valuable insights into trends, relationships, anomalies, and the impact of interventions. This knowledge empowers businesses and organizations to make informed decisions that drive success and adapt to evolving circumstances.
Remember, in the ever-changing landscape of data analysis, keeping an eye on how variables evolve over time can unlock hidden gems of information and provide a competitive edge in today’s dynamic world.
No Responses