Data Analysis Tools in Excel: Unleashing the Power of Spreadsheets
In today’s data-driven world, the ability to analyze and interpret data has become increasingly important. With the vast amount of information available, it is crucial to have efficient tools that can handle complex data analysis tasks. One such tool that has stood the test of time is Microsoft Excel.
Excel, a widely used spreadsheet program, offers a range of built-in features and functions specifically designed for data analysis. These tools empower users to organize, manipulate, and gain insights from their data without the need for extensive programming knowledge or specialized software.
One of the key features of Excel’s data analysis tools is its ability to handle large datasets. With Excel’s robust calculation engine and optimized memory management, users can work with millions of rows of data efficiently. This allows for comprehensive analysis without compromising performance.
Excel also provides a variety of statistical functions that enable users to perform complex calculations with ease. From basic measures like mean, median, and standard deviation to more advanced techniques such as regression analysis and hypothesis testing, these functions make it possible for users to extract meaningful information from their datasets.
Another powerful tool in Excel is PivotTables. PivotTables allow users to summarize and analyze large amounts of data quickly. By simply dragging and dropping fields into rows, columns, or values areas, users can create dynamic reports that provide a clear overview of their data. PivotTables also offer options for filtering, sorting, and grouping data on-the-fly, making it easy to spot trends or outliers.
For those dealing with time-series data or financial modeling, Excel’s built-in charting capabilities come in handy. Users can create visually appealing charts such as line graphs, bar charts, scatter plots, and more directly within Excel. These charts not only enhance the presentation of the data but also aid in understanding patterns and relationships.
Furthermore, Excel supports integration with external databases through its Power Query feature. This allows users to import data from various sources, such as databases, websites, or external files, and perform data transformations and cleansing operations. With Power Query, users can combine and shape data from multiple sources effortlessly, saving time and effort in the data preparation phase.
Excel’s data analysis tools also extend to advanced techniques like Solver and Scenario Manager. Solver enables users to find optimal solutions for complex optimization problems by adjusting variables within defined constraints. Scenario Manager allows users to create and analyze multiple scenarios by changing input values dynamically. These tools are particularly useful for decision-making processes and what-if analyses.
In conclusion, Excel’s data analysis tools provide a versatile and accessible platform for handling complex datasets. From basic statistical functions to advanced optimization techniques, Excel empowers users to explore their data, uncover insights, and make informed decisions. Whether you are a business professional, researcher, or student, mastering these tools can significantly enhance your analytical capabilities. So why not dive into the world of data analysis with Excel?
Frequently Asked Questions about Data Analysis Tools in Excel (UK)
- Is Excel considered a data analysis tool?
- What are the main tools in Excel?
- What are the data analysis tool?
- Where is the Excel data analysis tool?
- Is Excel the best data analysis tool?
Is Excel considered a data analysis tool?
Yes, Excel is widely considered a data analysis tool. While it is primarily known as a spreadsheet program, Excel offers a range of built-in features and functions specifically designed for data analysis. These tools allow users to organize, manipulate, and gain insights from their data without the need for extensive programming knowledge or specialized software.
Excel’s data analysis capabilities include statistical functions, PivotTables for summarizing and analyzing large datasets, charting options for visualizing data, integration with external databases through Power Query, and advanced techniques like Solver and Scenario Manager. These features make it possible to perform basic to advanced data analysis tasks within the Excel environment.
While there are more specialized tools available for specific types of data analysis or advanced statistical modeling, Excel remains a popular choice due to its accessibility, familiarity, and versatility. It provides a user-friendly interface that allows users of various skill levels to perform basic analysis tasks effectively.
What are the main tools in Excel?
Excel offers a wide range of tools that cater to various needs and tasks. Here are some of the main tools in Excel:
- Formulas and Functions: Excel provides a vast library of built-in formulas and functions that allow users to perform calculations, manipulate data, and automate processes. From basic arithmetic operations to complex statistical analysis, these functions enable users to derive insights from their data effortlessly.
- PivotTables: PivotTables are powerful tools for summarizing and analyzing large datasets. They allow users to create dynamic reports by summarizing data based on different criteria, such as grouping, filtering, or sorting. PivotTables provide a clear overview of the data and facilitate data exploration.
- Charts and Graphs: Excel’s charting capabilities enable users to create visually appealing charts and graphs directly within the spreadsheet. From bar charts to line graphs, scatter plots to pie charts, these visual representations help users understand patterns, trends, and relationships in their data.
- Data Validation: Data validation ensures that the entered data meets specific criteria or constraints defined by the user. It helps maintain data integrity by preventing errors or inconsistencies in the dataset.
- Conditional Formatting: Conditional formatting allows users to apply different formatting styles (e.g., font color, cell background) based on specific conditions or rules. This feature helps highlight important information or identify outliers in the dataset.
- Solver: Solver is an add-in tool in Excel that enables users to find optimal solutions for complex optimization problems. It adjusts variables within defined constraints to achieve a desired outcome.
- Power Query: Power Query is a powerful tool for importing, transforming, and cleansing data from various sources into Excel. It simplifies the process of combining multiple datasets, performing data transformations, and preparing data for analysis.
- What-If Analysis: What-If Analysis tools allow users to explore different scenarios by changing input values dynamically and observing the impact on calculated results. This feature is particularly useful for forecasting, financial modeling, and decision-making processes.
These are just a few of the main tools in Excel. The software offers a wide range of additional features and tools that cater to specific needs, making it a versatile tool for data analysis, reporting, and automation.
What are the data analysis tool?
Data analysis tools refer to software or applications that are specifically designed to assist in processing, organizing, and analyzing data. These tools help users extract valuable insights and make informed decisions based on the data they have collected. Here are some commonly used data analysis tools:
- Microsoft Excel: Excel is a widely used spreadsheet program that offers various built-in features and functions for data analysis, including statistical functions, PivotTables, charting capabilities, and more.
- Python: Python is a popular programming language with numerous libraries and packages dedicated to data analysis. Libraries such as NumPy, Pandas, and SciPy provide powerful tools for handling and analyzing data efficiently.
- R: R is another programming language widely used for statistical computing and graphics. It offers a vast collection of packages specifically designed for data analysis tasks, making it a popular choice among statisticians and researchers.
- Tableau: Tableau is a powerful data visualization tool that allows users to create interactive dashboards and reports from various data sources. It simplifies the process of visualizing complex datasets and helps users gain insights quickly.
- SQL: Structured Query Language (SQL) is a programming language used for managing relational databases. SQL provides powerful querying capabilities to retrieve specific sets of data from databases, making it an essential tool for analyzing large datasets stored in databases.
- MATLAB: MATLAB is a high-level programming language often used in scientific research and engineering fields. It provides extensive mathematical functions, visualization tools, and statistical analysis capabilities for working with complex datasets.
- SAS: SAS (Statistical Analysis System) is a software suite widely used in industries such as finance, healthcare, and market research for advanced analytics tasks like predictive modeling, data mining, and statistical analysis.
- SPSS: SPSS (Statistical Package for the Social Sciences) is a software package primarily used in social sciences research. It offers an extensive range of statistical procedures along with data management and data documentation capabilities.
- Apache Hadoop: Hadoop is an open-source framework that allows distributed processing of large datasets across clusters of computers. It is commonly used for big data analysis, enabling users to handle massive amounts of data efficiently.
- Google Analytics: Google Analytics is a web analytics tool that provides insights into website traffic, user behavior, and conversion rates. It helps businesses analyze their online presence and make data-driven decisions to optimize their websites or marketing strategies.
These are just a few examples of the many data analysis tools available today. The choice of tool depends on the specific requirements, complexity of the data, and the analytical tasks at hand.
Where is the Excel data analysis tool?
To access the data analysis tools in Excel, you need to enable the Data Analysis add-in. Here’s how you can do it:
- Open Excel and go to the “File” tab in the top left corner.
- Click on “Options” to open the Excel Options window.
- In the Excel Options window, select “Add-Ins” from the left-hand menu.
- At the bottom of the window, next to “Manage,” select “Excel Add-ins” from the drop-down menu and click on “Go.”
- In the Add-Ins window, check the box next to “Analysis ToolPak” and click on “OK.”
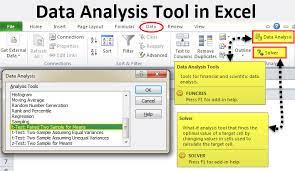
Once you have enabled the Data Analysis add-in, you can find it under the “Data” tab in Excel’s ribbon menu. Look for a section called “Analysis,” and within that section, you will see various data analysis tools such as Descriptive Statistics, Regression, Histograms, and more.
Clicking on any of these tools will open a dialog box where you can specify your data range and set additional parameters for your analysis. Choose the appropriate tool based on your analysis needs, follow the prompts, and Excel will generate the desired output or results.
Remember that enabling Data Analysis add-in is a one-time process. Once enabled, these tools will be available every time you open Excel unless you choose to disable them again through the Add-Ins window.
Note: The steps provided above are based on Microsoft Excel 2016 version. The location of options may vary slightly depending on your specific version of Excel.
Is Excel the best data analysis tool?
Excel is a widely used and versatile tool for data analysis, but whether it is the best tool depends on various factors and specific requirements. Here are some points to consider:
- Ease of use: Excel has a user-friendly interface that many people are familiar with, making it accessible to a wide range of users. Its intuitive spreadsheet format allows for easy data entry and manipulation.
- Data handling capabilities: Excel can handle moderately large datasets efficiently, but it may not be the optimal choice for extremely large or complex datasets that require advanced processing power or specialized software.
- Statistical functions: Excel offers a broad range of built-in statistical functions that cover many common analysis needs. However, more specialized statistical software may provide more advanced techniques or specific algorithms required for certain analyses.
- Visualization: Excel provides basic charting capabilities that allow users to create visually appealing charts and graphs. However, dedicated data visualization tools may offer more advanced features and customization options.
- Integration: Excel integrates well with other Microsoft Office applications, making it convenient for those already using Word, PowerPoint, or Outlook in their workflows. It also supports integration with external databases through Power Query.
- Customization and automation: While Excel provides options for customization through formulas, macros, and Visual Basic for Applications (VBA), other tools like programming languages (Python/R) or dedicated statistical software (SPSS, SAS) may offer more extensive customization and automation capabilities.
Ultimately, the choice of the best data analysis tool depends on your specific needs, the complexity of your data analysis tasks, and your level of expertise in different tools. It is often beneficial to explore multiple tools and consider using a combination of tools to leverage their respective strengths based on your requirements.
No Responses