Analysis Techniques: Unveiling the Hidden Insights
In today’s data-driven world, analysis techniques play a crucial role in extracting valuable insights from vast amounts of information. Whether it’s in the field of business, science, or any other domain, these techniques help us make informed decisions and uncover hidden patterns that can drive innovation and growth.
Analysis techniques refer to a set of methodologies and tools used to examine data systematically, identify trends, relationships, and correlations, and draw meaningful conclusions. They enable us to transform raw data into actionable knowledge, providing a solid foundation for evidence-based decision-making.
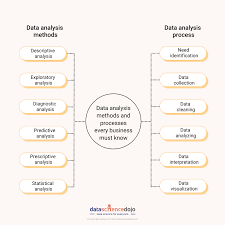
One widely used analysis technique is statistical analysis. It involves applying mathematical models and formulas to data sets to uncover patterns or relationships between variables. Statistical analysis helps us understand the significance of data points and make predictions based on probability theory. From market research to medical trials, statistical analysis is an essential tool for drawing accurate conclusions from complex data.
Another powerful technique is data mining. It involves exploring large datasets to discover patterns or relationships that may not be immediately apparent. By using algorithms and machine learning models, data mining helps analysts identify trends, anomalies, and predictive patterns. This technique has revolutionized various industries by enabling businesses to optimize operations, personalize customer experiences, detect frauds, and improve decision-making processes.
Text mining is yet another valuable technique that focuses on extracting meaningful information from unstructured text sources such as documents, social media posts, or customer reviews. By utilizing natural language processing algorithms and machine learning models, text mining allows analysts to gain insights into sentiment analysis, topic extraction, entity recognition, and summarization. This technique has become vital in areas like market research and customer feedback analysis.
Network analysis is a technique that examines relationships between entities in a network structure such as social networks or transportation systems. By analyzing connections between nodes (individuals or objects) and edges (relationships or interactions), network analysis helps uncover influential nodes or communities within the network. This technique has proven useful in understanding social dynamics, identifying key players, and optimizing network efficiency.
Simulation is another powerful analysis technique that allows analysts to model and mimic real-world scenarios. By creating virtual environments and running simulations, analysts can explore different scenarios, predict outcomes, and evaluate the impact of various factors. Simulation techniques are widely used in fields such as finance, urban planning, and engineering to test hypotheses, optimize processes, and mitigate risks.
These are just a few examples of analysis techniques that have transformed how we interpret data. As technology continues to advance rapidly, new techniques are emerging, providing even more sophisticated ways to analyze complex data sets.
In conclusion, analysis techniques are essential tools for extracting insights from data and driving informed decision-making. From statistical analysis to data mining, text mining to network analysis, these techniques enable us to uncover hidden patterns and make predictions that can shape our future. Embracing these techniques empowers businesses, scientists, and individuals alike to unlock the full potential of data-driven insights.
6 Effective Techniques for Analysis: A Comprehensive Guide
- Start by breaking down the task into smaller, manageable parts to make it easier to analyse.
- Ask yourself questions about the data you are analysing in order to gain a deeper understanding of it.
- Look for patterns or trends in the data that can help inform your analysis and conclusions.
- Utilise visualisations such as charts and graphs to help illustrate your findings and make them easier to understand.
- Ensure that you have considered all relevant factors when carrying out your analysis, including external influences such as economic or social factors which may affect the results of your analysis.
- Be sure to keep track of any changes made during the process so that you can easily refer back if needed in future analyses or reports on the same subject matter.
Start by breaking down the task into smaller, manageable parts to make it easier to analyse.
Analysis Techniques: Breaking Down the Task for Effective Analysis
When faced with a complex analysis task, it can often feel overwhelming. However, by employing a simple yet powerful tip of breaking down the task into smaller, manageable parts, you can make the analysis process much easier and more effective.
The idea behind this technique is to divide the larger analysis task into smaller, more digestible components. By doing so, you can focus on one aspect at a time, ensuring thorough examination and better understanding of each part. This approach not only helps in managing your workload but also enhances the accuracy and quality of your analysis.
Breaking down the task allows you to approach each component systematically. Start by identifying the key elements or variables that need to be analyzed. By defining these components, you create a roadmap for your analysis journey.
Once you have identified the components, allocate dedicated time and resources to analyze each one individually. This ensures that you give proper attention to every aspect and avoid overlooking critical details. It also helps in maintaining clarity throughout the process.
By breaking down the task into smaller parts, you gain a clearer perspective on each component’s significance within the larger context. This enables you to identify relationships, patterns, or trends specific to that particular element. It also facilitates easier comparison between different parts of your analysis.
Moreover, this technique allows for better collaboration within a team setting. Dividing the task into manageable parts enables team members to work on specific components independently while ensuring coherence in their individual analyses. It promotes efficient teamwork and fosters diverse perspectives on different aspects of the overall analysis.
Another benefit of this approach is that it helps in managing time effectively. By focusing on one part at a time, you can allocate resources efficiently and set realistic deadlines for completing each component. This prevents unnecessary delays and ensures timely completion of your analysis project.
Breaking down complex tasks into smaller parts is an invaluable technique in various fields such as business analytics, scientific research, and project management. It simplifies the analysis process, enhances accuracy, and improves overall productivity.
So, the next time you face a daunting analysis task, remember to break it down into smaller, manageable parts. Embrace this technique to approach your analysis with clarity, focus, and efficiency. By doing so, you’ll find that even the most complex analyses become more accessible and yield better insights.
Ask yourself questions about the data you are analysing in order to gain a deeper understanding of it.
Ask Yourself Questions: Unlocking Deeper Insights through Analysis Techniques
When it comes to analysing data, asking yourself questions can be a powerful technique to gain a deeper understanding of the information at hand. By actively engaging with the data and challenging your assumptions, you can uncover hidden insights and make more informed decisions.
Asking questions about the data you are analysing allows you to approach it from different angles and perspectives. It encourages critical thinking and helps you explore various dimensions that may have initially gone unnoticed. Here are some key questions to consider:
What is the purpose of this analysis?
Understanding the purpose behind your analysis sets the foundation for your approach. Are you trying to identify trends, evaluate performance, or solve a specific problem? Clarifying your objectives helps guide your questioning and ensures that your analysis aligns with your goals.
Where did this data come from?
Knowing the source of your data is crucial for understanding its reliability and potential biases. Was it collected internally or obtained from external sources? Is it primary or secondary data? Understanding the origin of the data allows you to assess its quality and relevance.
What are the variables or factors involved?
Identifying and defining the variables or factors within your dataset helps you focus on specific aspects during analysis. By breaking down complex information into manageable components, you can delve deeper into each variable’s characteristics, relationships, and potential impact on outcomes.
Are there any patterns or trends?
Look for patterns, trends, or anomalies within your data that may provide valuable insights. Are there recurring themes or fluctuations over time? Identifying these patterns can help uncover underlying causes or opportunities for improvement.
What are the limitations of this dataset?
Acknowledging the limitations of your dataset is essential for maintaining a realistic perspective during analysis. Are there missing values, incomplete records, or outliers? Understanding these limitations allows you to make informed decisions while also considering potential biases in your conclusions.
How can I validate or cross-reference this data?
Validation is crucial to ensure the accuracy and reliability of your analysis. Consider cross-referencing your findings with other sources or conducting sensitivity analyses to test the robustness of your results. This step adds credibility and strengthens the overall validity of your insights.
By asking yourself these questions and engaging in critical thinking, you can unlock deeper insights from the data you are analysing. Remember, analysis techniques are not just about crunching numbers; they involve actively exploring and challenging the information at hand.
As you delve into your data with a curious mindset, you will uncover valuable insights, discover new perspectives, and make more informed decisions. So, next time you embark on an analysis journey, don’t forget to ask yourself those important questions that will lead you towards a deeper understanding of your data.
Look for patterns or trends in the data that can help inform your analysis and conclusions.
Unlocking Insights: The Power of Patterns in Analysis Techniques
When it comes to analysis techniques, one valuable tip stands out: Look for patterns or trends in the data that can help inform your analysis and conclusions. Patterns are like breadcrumbs that lead us to hidden insights and a deeper understanding of the data we’re working with.
Patterns can appear in various forms, such as recurring sequences, fluctuations, or correlations between variables. By identifying these patterns, analysts can gain valuable insights into the underlying factors driving the data.
Why are patterns so important? Well, they provide a roadmap for interpretation. When we spot a pattern, it gives us clues about what might be happening within the dataset. It helps us make connections and formulate hypotheses that can then be tested and validated.
For example, imagine you’re analyzing sales data for a retail company. By observing a consistent pattern of increased sales during certain seasons or holidays, you can make informed decisions about inventory management or marketing campaigns. Recognizing these trends allows you to allocate resources effectively and maximize profitability.
Patterns also help us identify anomalies or outliers within the data. These outliers might represent unique events or circumstances that require further investigation. By understanding why these anomalies occur, we can gain insights into potential opportunities or risks that may impact our analysis.
Moreover, patterns enable us to make predictions based on historical data. By recognizing recurring trends, we can extrapolate future outcomes and anticipate potential scenarios. This foresight empowers decision-makers to proactively respond to changing circumstances and adapt strategies accordingly.
To uncover patterns effectively, it is essential to utilize appropriate analysis techniques such as statistical analysis or data mining mentioned earlier. These techniques help reveal relationships between variables and identify significant trends that may otherwise go unnoticed.
In conclusion, looking for patterns or trends in the data is a fundamental aspect of analysis techniques. It allows us to go beyond surface-level observations and delve into the underlying factors driving the data. By recognizing patterns, we gain valuable insights, make informed decisions, and unlock the potential for innovation and growth. So, next time you embark on an analysis journey, remember to keep an eye out for those enlightening patterns that can guide you towards a deeper understanding of your data.
Utilise visualisations such as charts and graphs to help illustrate your findings and make them easier to understand.
Utilise Visualisations: Bringing Clarity to Analysis Techniques
In the realm of analysis techniques, one powerful tool stands out for its ability to enhance understanding and clarity: visualisations. By incorporating charts and graphs into your analysis process, you can effectively illustrate your findings and make complex data easier to comprehend.
Visualisations serve as a bridge between raw data and meaningful insights. They transform numbers, trends, and relationships into visually appealing representations that are more accessible to the human mind. When used strategically, visualisations can simplify complex concepts, highlight patterns, and present information in a concise and engaging manner.
Charts and graphs offer a variety of formats that cater to different types of data. For instance, line charts are ideal for showcasing trends over time, while bar charts enable easy comparison between categories. Pie charts provide a clear representation of proportions or percentages, while scatter plots help identify correlations between variables. The choice of visualisation depends on the nature of the data and the story you want to convey.
By utilising visualisations in your analysis techniques, you can unlock several benefits. Firstly, they facilitate quick comprehension by condensing large amounts of information into visually digestible forms. Instead of sifting through rows of numbers or lengthy reports, stakeholders can grasp key insights at a glance.
Secondly, visualisations enable effective communication among diverse audiences. Whether presenting findings to colleagues, clients, or stakeholders with varying levels of expertise in the subject matter, visual representations transcend language barriers and simplify complex ideas. They ensure that everyone involved can grasp the main points without getting lost in technical jargon.
Moreover, visualisations promote engagement and retention. Human brains are wired to process images more efficiently than text alone. By incorporating visuals into your analysis techniques, you tap into this inherent cognitive advantage and increase audience engagement with your findings. Visuals also aid memory retention by creating mental associations that are easier to recall later on.
When creating visualisations for analysis purposes, it’s crucial to maintain accuracy and clarity. Choose appropriate scales, labels, and titles to ensure that the message conveyed aligns with the data being presented. Avoid cluttering your visualisations with excessive details or unnecessary embellishments that could distract from the main insights.
In summary, utilising visualisations such as charts and graphs is a valuable tip for enhancing analysis techniques. These visual representations transform complex data into easily understandable formats, facilitating comprehension, communication, engagement, and retention of key insights. By incorporating visuals into your analytical toolkit, you can effectively convey your findings and make a lasting impact on your audience.
Ensure that you have considered all relevant factors when carrying out your analysis, including external influences such as economic or social factors which may affect the results of your analysis.
The Importance of Considering Relevant Factors in Analysis Techniques
When conducting any analysis, it is crucial to consider all relevant factors that may influence the results. While focusing on internal data and variables is essential, it is equally important to take into account external influences, such as economic or social factors, that can significantly impact the outcomes of your analysis.
External factors can have a profound effect on the data you are analyzing. Economic factors, for example, can shape market conditions and consumer behavior. Changes in interest rates, inflation rates, or overall economic stability can directly impact sales figures, investment decisions, and profitability. By incorporating these economic factors into your analysis, you gain a more comprehensive understanding of the underlying trends and patterns.
Similarly, social factors can also play a significant role in shaping outcomes. Cultural shifts, demographic changes, or evolving consumer preferences can greatly impact business strategies and market dynamics. For instance, understanding social trends and attitudes towards sustainability might influence product development decisions or marketing campaigns. By considering these external social influences during your analysis process, you gain valuable insights that can guide your decision-making.
By neglecting external influences in your analysis techniques, you run the risk of oversimplifying complex scenarios or missing vital information that could alter your conclusions. Failing to account for relevant factors may lead to inaccurate predictions or flawed strategies.
To ensure a comprehensive analysis:
- Identify relevant external factors: Take the time to identify key economic or social factors that could potentially affect your analysis. Consider industry-specific trends as well as broader macroeconomic indicators.
- Gather reliable data: Seek out reputable sources of information for these external influences to ensure accuracy and reliability in your analysis.
- Analyze correlations: Once you have gathered both internal and external data sets, examine correlations between them to understand how different variables interact with one another.
- Adjust models if necessary: If you find significant correlations between external factors and your internal data sets, consider adjusting your analytical models or incorporating additional variables to account for these influences.
- Regularly update your analysis: External factors can change rapidly, so it is crucial to continuously monitor and update your analysis as new data becomes available.
By considering all relevant factors, including external influences, you enhance the robustness and accuracy of your analysis techniques. This broader perspective allows you to make more informed decisions and adapt strategies that align with the ever-changing business and societal landscapes.
Be sure to keep track of any changes made during the process so that you can easily refer back if needed in future analyses or reports on the same subject matter.
The Importance of Documentation in Analysis Techniques
When it comes to analysis techniques, one often overlooked but crucial aspect is proper documentation. Keeping track of any changes made during the analysis process can prove to be invaluable for future reference and analysis on the same subject matter.
Documentation serves as a record of the steps taken, decisions made, and modifications implemented throughout the analysis. It ensures transparency, reproducibility, and accuracy in your work. By documenting each stage of the analysis, you create a reliable trail that can be revisited and referenced whenever necessary.
One key benefit of documentation is its role in ensuring consistency. As you delve into complex data sets or employ various techniques, it’s easy to get lost or forget certain details along the way. By documenting your process, you provide yourself with a roadmap that helps maintain consistency in your approach. This not only aids in avoiding errors but also allows others to follow your methodology and replicate your findings if needed.
Documenting changes made during analysis also facilitates collaboration within teams or across different projects. It enables effective communication by providing a clear history of modifications made by different team members. This ensures that everyone is on the same page and prevents confusion or duplication of efforts.
Moreover, documentation serves as a valuable resource for future analyses or reports on similar subjects. By referring back to previous analyses, you can gain insights into past methodologies, compare results, and build upon existing knowledge. This saves time and effort by leveraging prior work rather than starting from scratch.
To effectively document your analysis process, consider using a structured approach such as creating a detailed log or maintaining version control for your files. Include information such as date and time stamps for each change made, descriptions of modifications implemented, and any relevant notes or observations along the way.
In addition to maintaining records during the analysis itself, it’s important to organize and store your documentation securely for easy retrieval later on. This could involve creating a dedicated folder or database specifically for analysis documentation, ensuring that it is easily accessible and well-organized.
In conclusion, keeping track of changes made during the analysis process through proper documentation is essential. It promotes consistency, facilitates collaboration, and provides a valuable resource for future analyses. By investing time in documenting your work, you ensure that your analysis techniques remain transparent, reproducible, and reliable over time.
No Responses