Data Analytics for Beginners: Unlocking the Power of Data
In today’s digital age, data is being generated at an unprecedented rate. From social media interactions to online purchases, every action we take leaves a digital footprint. This abundance of data presents a unique opportunity for businesses and individuals alike to gain valuable insights and make informed decisions. This is where data analytics comes into play.
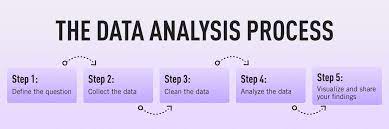
Data analytics is the process of examining raw data to uncover patterns, draw conclusions, and make predictions. It involves collecting, cleaning, transforming, and analyzing data to extract meaningful information. While it may sound complex, data analytics can be approached by beginners with the right tools and mindset.
The first step in diving into the world of data analytics is understanding the types of data available. Data can be categorized into structured and unstructured forms. Structured data refers to well-organized information that fits neatly into predefined tables or databases. Unstructured data, on the other hand, includes text documents, images, videos, and social media posts that are not easily organized.
To start your journey in data analytics, it’s essential to familiarize yourself with basic statistical concepts. Statistical analysis helps you make sense of your data by identifying trends and patterns. Key concepts such as mean, median, mode, standard deviation, and correlation will become your allies in uncovering insights from your datasets.
Next comes the selection of appropriate tools for analysis. There are numerous software programs available that cater to different levels of expertise. For beginners, user-friendly tools like Microsoft Excel or Google Sheets can serve as a great starting point. These platforms offer built-in functions for basic statistical analysis and visualization.
As you progress in your learning journey, you may want to explore more advanced tools such as Python or R programming languages. These open-source languages provide extensive libraries for statistical analysis and machine learning algorithms. Online tutorials and courses can guide you through the process of using these tools effectively.
Once you have equipped yourself with the necessary knowledge and tools, it’s time to gather and clean your data. Data cleaning involves removing duplicates, correcting errors, and handling missing values. This step ensures that your analysis is based on accurate and reliable information.
With clean data in hand, you can now begin exploring patterns and relationships within your dataset. Visualization techniques such as charts, graphs, and dashboards help you present your findings in a visually appealing and easy-to-understand manner. Tools like Tableau or Power BI enable you to create interactive visualizations without the need for extensive coding.
As you delve deeper into data analytics, you may want to explore predictive modeling. This involves using historical data to build models that can predict future outcomes. Machine learning algorithms play a significant role in this process, allowing you to uncover hidden patterns and make accurate predictions.
Remember that data analytics is an iterative process. It requires continuous learning, experimentation, and refinement of your analytical skills. As you gain more experience, you’ll be able to tackle more complex problems and extract even greater insights from your data.
In conclusion, data analytics is a powerful tool that empowers individuals and businesses to make informed decisions based on evidence rather than intuition. By understanding the basics of data analysis, selecting appropriate tools, cleaning data effectively, exploring patterns through visualization, and utilizing predictive modeling techniques, beginners can unlock the true potential of their datasets. So why wait? Start your journey into the fascinating world of data analytics today!
5 Essential Tips for Beginners in Data Analytics
- Start by learning the basics of data analytics – understand what data analysis is and how it works.
- Understand the different types of data analysis techniques and when to use them.
- Get familiar with the tools used in data analysis such as spreadsheets, databases, statistical software, etc.
- Practice analysing mock datasets to gain experience and confidence in your skillset.
- Ask questions! Don’t be afraid to ask for help from experienced professionals or join online discussion forums for advice on best practices and strategies for success in data analytics
Start by learning the basics of data analytics – understand what data analysis is and how it works.
Start by Learning the Basics of Data Analytics: Understanding the Power of Data Analysis
Data analytics has become an integral part of decision-making processes in various industries. Whether you are a business professional, a student, or simply someone curious about the power of data, learning the basics of data analytics is a great starting point.
At its core, data analytics involves extracting meaningful insights from raw data to drive informed decisions. It enables us to uncover patterns, trends, and correlations that might otherwise go unnoticed. By understanding what data analysis is and how it works, you can begin harnessing the power of data to your advantage.
To begin your journey into data analytics, it’s crucial to grasp the fundamental concepts. Start by familiarizing yourself with key terms such as structured and unstructured data, statistical analysis, and visualization techniques. Understand how different types of data can be collected and organized for analysis.
Structured data refers to well-organized information that fits neatly into predefined tables or databases. This type of data is typically easier to work with as it follows a consistent format. Unstructured data, on the other hand, includes text documents, images, videos, and social media posts that are not easily organized. This type of data requires additional preprocessing before analysis.
Statistical analysis is an essential component of data analytics. It involves using mathematical techniques to analyze datasets and draw meaningful conclusions. Concepts such as mean (average), median (middle value), mode (most frequent value), standard deviation (measure of variability), and correlation (relationship between variables) are key tools in uncovering insights from your datasets.
Visualization techniques play a vital role in presenting your findings effectively. Charts, graphs, and dashboards help communicate complex information in a visually appealing manner. Understanding how to create visualizations using tools like Microsoft Excel or specialized software like Tableau can enhance your ability to convey insights clearly.
Once you have grasped these foundational concepts, you can start exploring real-world examples and case studies. Look for practical applications of data analytics in your field of interest. This will help you understand how data analysis is used to solve problems and make informed decisions in various industries.
There are numerous online resources available to help you learn the basics of data analytics. Online courses, tutorials, and communities provide valuable insights and hands-on experience. Engaging with these resources will not only deepen your understanding but also expose you to different tools and techniques used in the field.
Remember, learning data analytics is an ongoing process. As you progress, challenge yourself to work with more complex datasets and explore advanced techniques such as predictive modeling and machine learning. Continuously expanding your knowledge will enable you to tackle more significant challenges and uncover deeper insights.
In conclusion, starting by learning the basics of data analytics is a crucial step towards harnessing the power of data. Understanding what data analysis is, familiarizing yourself with key concepts, exploring visualization techniques, and delving into real-world examples will set a solid foundation for your journey into the world of data analytics. Embrace this exciting field, and unlock the potential that lies within your datasets!
Understand the different types of data analysis techniques and when to use them.
Understanding the Different Types of Data Analysis Techniques: A Tip for Beginners in Data Analytics
In the vast realm of data analytics, one essential tip for beginners is to grasp the different types of data analysis techniques and when to apply them. This knowledge will enable you to extract meaningful insights from your datasets effectively.
Let’s explore some common data analysis techniques:
- Descriptive Analysis: This technique involves summarizing and describing data using statistical measures such as mean, median, mode, and standard deviation. Descriptive analysis helps you understand the basic characteristics of your dataset, providing a snapshot of what the data looks like.
- Inferential Analysis: Inferential analysis allows you to draw conclusions or make predictions about a larger population based on a smaller sample. By applying statistical tests and probability theory, you can infer insights beyond the observed data. This technique is useful when you want to make generalizations or test hypotheses.
- Diagnostic Analysis: When you encounter unexpected patterns or outliers in your data, diagnostic analysis comes into play. It helps identify the causes behind these anomalies by examining relationships between variables. Diagnostic analysis often involves techniques such as regression analysis or hypothesis testing.
- Predictive Analysis: Predictive analysis utilizes historical data to build models that can forecast future outcomes accurately. By employing machine learning algorithms and statistical modeling techniques, predictive analysis enables you to make informed predictions based on patterns and trends in your datasets.
- Prescriptive Analysis: Prescriptive analysis takes predictive analysis one step further by suggesting optimal actions or solutions based on predicted outcomes. It leverages advanced algorithms and optimization techniques to guide decision-making processes effectively.
Knowing when to use each technique is crucial for successful data analysis:
– If you want to gain an overall understanding of your dataset’s characteristics, start with descriptive analysis.
– When drawing conclusions about a larger population or testing hypotheses, employ inferential analysis.
– For investigating unusual patterns or outliers, diagnostic analysis will help uncover underlying causes.
– When you need to make predictions about future outcomes, predictive analysis is the way to go.
– If you want to provide actionable recommendations based on predicted outcomes, prescriptive analysis is your tool.
Remember that these techniques are not mutually exclusive and can often be combined to gain a more comprehensive understanding of your data. The choice of technique depends on the specific objectives of your analysis and the nature of your dataset.
By understanding the different types of data analysis techniques and when to use them, beginners in data analytics can approach their projects with a well-informed strategy. This knowledge empowers you to extract meaningful insights, make accurate predictions, and drive informed decision-making processes. So, dive into the world of data analysis armed with this valuable tip and unlock the full potential of your datasets!
Get familiar with the tools used in data analysis such as spreadsheets, databases, statistical software, etc.
Data Analytics for Beginners: Getting Familiar with the Tools of the Trade
If you’re a beginner in the field of data analytics, one of the most important tips to keep in mind is to get familiar with the tools used in data analysis. These tools are essential for collecting, organizing, and analyzing data effectively. By understanding and mastering these tools, you’ll be well-equipped to embark on your data analytics journey.
One of the most widely used tools in data analysis is spreadsheets. Programs like Microsoft Excel or Google Sheets provide a user-friendly interface for organizing and manipulating data. Spreadsheets allow you to input, store, and perform basic calculations on your datasets. They also offer built-in functions for statistical analysis, making it easier to uncover patterns and insights.
Databases are another crucial tool in data analytics. They provide a structured way to store large volumes of data and enable efficient retrieval and management. Familiarizing yourself with database concepts such as tables, queries, and relationships will be beneficial when working with complex datasets.
Statistical software is another essential tool that aids in data analysis. Programs like SPSS, SAS, or R provide advanced statistical capabilities that go beyond what spreadsheets can offer. These software packages allow you to perform complex statistical analyses and build predictive models using various algorithms.
In addition to these core tools, it’s also worth exploring visualization software such as Tableau or Power BI. These tools enable you to create visually appealing charts, graphs, and dashboards that help convey your findings effectively. Visualization plays a crucial role in presenting insights from your data in a clear and understandable manner.
As a beginner in data analytics, it’s important not to feel overwhelmed by the multitude of available tools. Start by mastering one or two tools that suit your specific needs and gradually expand your skill set as you gain more experience.
There are numerous resources available online that offer tutorials, courses, and documentation on these tools. Take advantage of these resources to learn the basics and gain hands-on experience. Additionally, joining online communities or forums dedicated to data analytics can provide valuable insights and support from fellow beginners and experienced professionals.
Remember, becoming proficient with these tools takes time and practice. Don’t be afraid to experiment, make mistakes, and learn from them. The more you familiarize yourself with the tools of data analysis, the more confident and effective you will become in harnessing the power of data.
In conclusion, getting familiar with the tools used in data analysis is a crucial step for beginners. Spreadsheets, databases, statistical software, and visualization tools are essential for collecting, organizing, analyzing, and presenting data effectively. By investing time in learning these tools and gaining hands-on experience, you’ll be well on your way to becoming a proficient data analyst. So roll up your sleeves, dive into the world of data analytics tools, and unlock the potential of your datasets!
Practice analysing mock datasets to gain experience and confidence in your skillset.
Practice Analysing Mock Datasets: Building Confidence in Data Analytics
Data analytics can be a daunting field, especially for beginners. The sheer volume of data and the complexity of analysis techniques can leave one feeling overwhelmed. However, there is a simple yet effective tip that can help you gain confidence and improve your data analytics skills: practice analysing mock datasets.
Mock datasets are artificially created datasets that mimic real-world scenarios. They are designed to provide a safe and controlled environment for beginners to experiment with different analysis techniques without the fear of making mistakes or compromising real data.
By working with mock datasets, you can familiarize yourself with the entire data analytics process – from data cleaning and preparation to visualization and interpretation. This hands-on experience allows you to apply theoretical knowledge in a practical setting, reinforcing your understanding of key concepts.
Start by identifying mock datasets that align with your interests or goals. There are various resources available online, such as public repositories or sample datasets provided by data analytics platforms. These datasets cover a wide range of industries and topics, including finance, marketing, healthcare, and social sciences.
Once you have selected a mock dataset, begin by exploring its structure and contents. Understand the variables involved and their relationships. This step helps you gain insights into the dataset’s characteristics and potential analysis approaches.
Next, practice cleaning the data. Mock datasets often contain errors intentionally inserted to simulate real-world imperfections. By identifying and correcting these errors, you develop essential skills in data cleaning techniques such as handling missing values, removing duplicates, or transforming variables.
After cleaning the dataset, it’s time to apply analytical techniques. Start with basic statistical analysis methods like calculating descriptive statistics or conducting hypothesis tests. As you become more comfortable, progress towards more advanced techniques like regression analysis or clustering algorithms.
Visualization is another crucial aspect of data analytics. Use tools like Excel or Python libraries like Matplotlib or Seaborn to create charts and graphs that effectively communicate your findings. Experiment with different visualization techniques to enhance your storytelling abilities and improve data interpretation.
As you practice analysing mock datasets, don’t be afraid to make mistakes. Mistakes are valuable learning opportunities that help you refine your analytical skills. Take note of the challenges you encounter and seek solutions through online resources, forums, or communities dedicated to data analytics.
Remember, building confidence in data analytics takes time and practice. The more mock datasets you analyse, the more comfortable you will become with different analysis techniques and tools. This practical experience will equip you with the skills needed to tackle real-world challenges confidently.
In conclusion, practicing analysing mock datasets is an excellent way for beginners to gain experience and confidence in their data analytics skillset. By working with artificial datasets that simulate real-world scenarios, you can apply theoretical knowledge in a practical setting, refine your analytical techniques, and build a solid foundation for future data analysis endeavours. So start exploring those mock datasets today and unlock the true potential of your data analytics journey!
Ask questions! Don’t be afraid to ask for help from experienced professionals or join online discussion forums for advice on best practices and strategies for success in data analytics
Ask Questions: The Key to Success in Data Analytics for Beginners
Embarking on a journey into the world of data analytics can be both exciting and challenging. As a beginner, it’s natural to have questions and uncertainties about the best practices and strategies for success. In such situations, never hesitate to ask for help from experienced professionals or join online discussion forums.
One of the most valuable tips for beginners in data analytics is to ask questions. Don’t be afraid to seek guidance from those who have already walked the path you are embarking on. Experienced professionals in the field can provide insights, share their experiences, and offer practical advice that can save you time and effort.
Online discussion forums dedicated to data analytics are treasure troves of knowledge waiting to be explored. These platforms bring together a community of like-minded individuals who are passionate about data analysis. By actively participating in these forums, you can tap into a wealth of collective wisdom and learn from others’ experiences.
When asking questions, be specific about the challenges you are facing or the areas where you need assistance. This will help experts and forum members provide targeted advice that directly addresses your concerns. Remember that there is no such thing as a silly question when it comes to learning something new.
Engaging with professionals and participating in online discussions not only helps you find answers but also exposes you to different perspectives and approaches in data analytics. You may discover alternative methods or tools that could enhance your analytical skills or streamline your workflow.
Asking questions also fosters networking opportunities within the data analytics community. Building connections with experienced professionals can open doors to mentorship, collaboration, or even potential job opportunities down the line.
In addition to seeking help from others, don’t forget about self-learning resources such as books, online tutorials, and courses dedicated to data analytics. Combining self-study with guidance from experts will give you a well-rounded learning experience.
Remember, asking questions demonstrates your eagerness to learn and grow as a data analyst. It shows that you are proactive in seeking knowledge and are committed to honing your skills. Embrace the mindset of a lifelong learner, and don’t hesitate to reach out for support whenever you need it.
In conclusion, asking questions is an essential tip for beginners in data analytics. Seeking help from experienced professionals and engaging in online discussion forums can provide valuable insights, practical advice, and networking opportunities. Embrace the learning journey, be curious, and never hesitate to ask for guidance. With the right support and a thirst for knowledge, you’ll be well on your way to success in data analytics.
No Responses