Time Series Forecasting with Machine Learning: Unlocking the Power of Predictive Analytics
In today’s data-driven world, businesses and organizations are constantly seeking ways to make informed decisions and gain a competitive edge. Time series forecasting, a powerful technique in the realm of predictive analytics, has emerged as a valuable tool for predicting future trends and patterns based on historical data.
What is Time Series Forecasting?
Time series forecasting involves analyzing and predicting future values based on patterns observed in historical data collected over time. This technique is widely used in various industries, including finance, retail, healthcare, energy, and more. It helps businesses anticipate demand, optimize resource allocation, improve inventory management, and make accurate predictions for planning purposes.
The Role of Machine Learning
Machine learning algorithms have revolutionized time series forecasting by providing accurate predictions based on complex patterns and relationships within the data. These algorithms can automatically learn from historical observations to identify trends, seasonality, cyclicality, and other factors that influence the target variable.
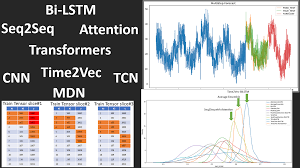
Popular Machine Learning Algorithms for Time Series Forecasting
Autoregressive Integrated Moving Average (ARIMA): ARIMA is a widely used algorithm that models the linear relationships between past observations and their lags to forecast future values. It considers three components: autoregression (AR), differencing (I), and moving average (MA).
Exponential Smoothing Methods: Exponential smoothing algorithms use weighted averages of past observations to predict future values. These methods include Simple Exponential Smoothing (SES), Holt’s Linear Trend Method (Holt), and Holt-Winters’ Seasonal Method.
Long Short-Term Memory (LSTM) Networks: LSTM networks are a type of recurrent neural network (RNN) that can capture long-term dependencies in sequential data. They excel at handling complex temporal patterns by incorporating memory cells that retain information over extended periods.
Gradient Boosting Machines (GBM): GBM algorithms, such as XGBoost and LightGBM, are powerful ensemble methods that combine multiple weak learners to make accurate predictions. They are particularly effective when dealing with large and diverse time series datasets.
Challenges in Time Series Forecasting
Time series forecasting presents unique challenges compared to other machine learning tasks. Some of these challenges include handling missing or irregular data, dealing with seasonality and trends, accounting for outliers, and selecting appropriate evaluation metrics.
Best Practices for Time Series Forecasting
To achieve accurate predictions with machine learning in time series forecasting, it is essential to follow best practices:
Data Preprocessing: Cleanse the data by handling missing values, outliers, and smoothing irregularities. Ensure consistent time intervals and handle seasonality appropriately.
Feature Engineering: Extract relevant features from the data that capture important patterns and relationships. These features can include lagged variables, moving averages, or other domain-specific attributes.
Model Selection: Choose the appropriate algorithm based on the characteristics of your dataset and the problem at hand. Experiment with different models to find the best fit.
Hyperparameter Tuning: Fine-tune the model’s hyperparameters to optimize its performance. This process involves adjusting parameters like learning rate, regularization strength, or number of hidden layers.
Evaluation and Validation: Use appropriate evaluation metrics such as mean absolute error (MAE), root mean squared error (RMSE), or mean absolute percentage error (MAPE) to assess the accuracy of your forecasts. Validate your models using cross-validation techniques.
Conclusion
Time series forecasting with machine learning has become an invaluable tool for businesses seeking to make informed decisions based on historical data patterns. By leveraging powerful algorithms like ARIMA, LSTM networks, exponential smoothing methods, and GBM techniques, organizations can unlock valuable insights into future trends and improve their planning processes.
As technology continues to advance and more sophisticated algorithms emerge, time series forecasting will only become more accurate and efficient. By embracing the power of machine learning in this domain, businesses can gain a competitive advantage and stay ahead in today’s data-driven world.
5 Time Series Forecasting Tips: From Basic Models to Advanced Techniques
- Start with a basic model and gradually increase complexity as needed.
- Explore the data to identify any seasonal patterns and trends that may be useful in forecasting.
- Use multiple techniques to compare the accuracy of different models for the same dataset.
- Consider incorporating external factors such as economic indicators or weather data into your model.
- Utilise automated machine learning tools to quickly build, evaluate, and optimise models without manual coding.
Start with a basic model and gradually increase complexity as needed.
Start with a Basic Model and Gradually Increase Complexity in Time Series Forecasting with Machine Learning
When it comes to time series forecasting with machine learning, it’s important to approach the task with a systematic and iterative mindset. One effective tip is to start with a basic model and gradually increase complexity as needed. This approach allows for a better understanding of the data, helps identify patterns, and ultimately leads to more accurate predictions.
Why Start with a Basic Model?
Beginning with a basic model provides a solid foundation for understanding the underlying patterns and dynamics of the time series data. Simple models, such as Autoregressive Integrated Moving Average (ARIMA) or Exponential Smoothing Methods, can capture initial trends and seasonality. They serve as an excellent starting point before diving into more complex algorithms.
Benefits of Gradually Increasing Complexity
As you gain insights from the basic model, you can gradually introduce more sophisticated techniques to enhance your forecasting accuracy. Increasing complexity allows for capturing additional factors that may influence the target variable. For example, incorporating lagged variables or using advanced algorithms like Long Short-Term Memory (LSTM) networks or Gradient Boosting Machines (GBM) can improve predictions by capturing long-term dependencies or handling diverse datasets.
The gradual increase in complexity also helps in identifying potential pitfalls or challenges that may arise during the modeling process. It allows you to assess whether the additional complexity is justified based on improvements in forecast accuracy or if it introduces unnecessary computational costs.
Iterative Approach for Continuous Improvement
Time series forecasting is an iterative process that requires continuous improvement and refinement. By starting with a basic model and incrementally increasing complexity, you can evaluate the impact of each enhancement on forecast performance. This iterative approach enables you to fine-tune hyperparameters, experiment with different features, and assess various model architectures effectively.
Moreover, this method facilitates interpretability and transparency by allowing you to understand how each added component contributes to the overall prediction. It helps in identifying which factors are most influential and provides valuable insights into the underlying dynamics of the time series.
Conclusion
Starting with a basic model and gradually increasing complexity is a valuable tip when it comes to time series forecasting with machine learning. By following this approach, you can build a strong foundation, gain insights from the data, and improve forecast accuracy. Remember to evaluate the impact of each enhancement and iterate on your models for continuous improvement. With this systematic approach, you can unlock the full potential of machine learning in time series forecasting and make more accurate predictions for better decision-making.
Explore the data to identify any seasonal patterns and trends that may be useful in forecasting.
Exploring Data for Time Series Forecasting: Unveiling Seasonal Patterns and Trends
When it comes to time series forecasting using machine learning, one essential tip is to thoroughly explore the data before diving into the modelling process. By carefully examining the dataset, we can uncover valuable insights about seasonal patterns and trends that can significantly enhance the accuracy of our forecasts.
Seasonal patterns refer to recurring patterns or fluctuations that occur within a specific time frame, such as daily, weekly, monthly, or yearly cycles. These patterns can have a significant impact on the target variable we are trying to forecast. For example, in retail sales data, we might observe higher sales during weekends or holiday seasons.
Trends, on the other hand, capture long-term changes in the data over time. They can be upward (indicating growth) or downward (indicating decline) trends. Identifying these trends is crucial as they provide valuable information about the overall direction of the target variable.
By exploring the data for seasonal patterns and trends, we gain insights that help us select appropriate forecasting models and make accurate predictions. Here are some steps to follow when exploring your time series dataset:
- Visualize the Data: Plotting your time series data allows you to observe any apparent patterns visually. Use line plots or scatter plots to visualize how your target variable changes over time. Look for recurring cycles or any noticeable upward or downward trends.
- Decompose the Time Series: Decomposition techniques like additive or multiplicative decomposition help separate your time series into its individual components: trend, seasonality, and residual (random fluctuations). This decomposition allows you to analyze each component separately and understand their contributions to the overall pattern.
- Calculate Rolling Statistics: Compute rolling statistics such as moving averages or rolling standard deviations over a specific window size. These statistics smooth out short-term fluctuations and highlight longer-term trends in your data.
- Analyze Autocorrelation: Autocorrelation measures the relationship between a time series and its lagged versions. Plotting autocorrelation functions (ACF) or partial autocorrelation functions (PACF) helps identify significant lags that can indicate seasonal patterns or trends.
- Perform Seasonality Tests: Apply statistical tests like the Augmented Dickey-Fuller (ADF) test to assess the presence of seasonality or trends in your data. These tests provide quantitative evidence to support your visual observations.
By thoroughly exploring the data for seasonal patterns and trends, we gain a deeper understanding of how our target variable behaves over time. This knowledge guides us in selecting appropriate forecasting models, incorporating relevant features, and fine-tuning our algorithms for optimal performance.
Remember, accurate time series forecasting relies on the ability to capture and leverage these underlying patterns effectively. So, take the time to explore your data before embarking on the modelling journey. It will undoubtedly pay off by improving the accuracy and reliability of your predictions.
Use multiple techniques to compare the accuracy of different models for the same dataset.
Enhancing Time Series Forecasting Accuracy: Comparing Multiple Techniques for Optimal Results
In the realm of time series forecasting with machine learning, accuracy is paramount. Businesses and organizations rely on accurate predictions to make informed decisions and gain a competitive edge. One effective tip to improve accuracy is to use multiple techniques and compare the performance of different models on the same dataset.
Why Compare Multiple Techniques?
Time series forecasting involves dealing with complex patterns and relationships within data. No single technique or algorithm can guarantee optimal results for every dataset and problem. By employing multiple techniques, we can leverage their unique strengths and identify which model performs best for a particular dataset.
The Benefits of Comparing Models
Comparing multiple techniques offers several benefits in time series forecasting:
Performance Evaluation: By evaluating the accuracy of different models, we can assess their strengths and weaknesses. This allows us to identify the most reliable methods for our specific dataset, ensuring more accurate forecasts.
Model Selection: Through comparison, we can select the most appropriate model for our forecasting task. Different algorithms have varying capabilities in handling seasonality, trends, outliers, or other characteristics present in the data.
Confidence Building: Employing multiple techniques provides a level of confidence in our forecasts. When different models consistently produce similar results, it strengthens our belief in the accuracy of those predictions.
Robustness Testing: Comparing models helps us understand how they perform under varying conditions or changes in data patterns. It allows us to assess their robustness and reliability over time.
How to Compare Models
To compare the accuracy of different models for a given dataset, follow these steps:
Data Splitting: Divide your dataset into training and testing sets. The training set is used to train each model on historical data, while the testing set remains unseen until evaluation.
Model Training: Train each model using appropriate algorithms such as ARIMA, LSTM networks, exponential smoothing methods, or GBM techniques.
Forecasting: Utilize the trained models to generate forecasts for the testing set.
Evaluation: Compare the accuracy of each model’s forecasts against the actual values in the testing set using evaluation metrics such as MAE, RMSE, or MAPE. These metrics quantify the differences between predicted and actual values.
Analysis and Selection: Analyze the results to determine which model performs best for your dataset. Consider factors like accuracy, consistency, computational efficiency, and interpretability.
Refinement and Iteration: If necessary, refine your chosen model by adjusting hyperparameters or incorporating additional features. Repeat the comparison process to ensure continual improvement.
By comparing multiple techniques and evaluating their performance on the same dataset, we can identify optimal models for time series forecasting tasks. This approach enhances accuracy, builds confidence in our predictions, and enables us to make more informed decisions based on reliable forecasts.
In conclusion, employing multiple techniques for time series forecasting allows us to leverage their strengths and choose the most accurate model for a given dataset. By comparing performance using evaluation metrics, we can make informed decisions that lead to improved forecasting accuracy and better outcomes for businesses and organizations relying on predictive analytics.
Consider incorporating external factors such as economic indicators or weather data into your model.
Enhancing Time Series Forecasting with External Factors: Incorporating Economic Indicators and Weather Data
When it comes to time series forecasting using machine learning, considering external factors can significantly improve the accuracy and reliability of predictions. By incorporating relevant external variables such as economic indicators or weather data into your forecasting model, you can capture additional insights and uncover hidden patterns that may influence the target variable.
Why Incorporate External Factors?
While historical data alone provides valuable information about past trends, it may not always capture the full picture of what drives future outcomes. External factors, such as economic indicators or weather conditions, can have a significant impact on various industries and influence the behaviour of time series data.
For example, in retail forecasting, incorporating economic indicators like GDP growth rates or consumer sentiment indices can help predict consumer spending patterns. Similarly, in energy demand forecasting, weather data such as temperature or precipitation can greatly affect electricity consumption.
How to Incorporate External Factors?
To incorporate external factors into your time series forecasting model, follow these steps:
Identify Relevant External Variables: Determine which external factors are likely to influence the target variable based on domain knowledge and research. For example, if you are predicting sales for a retail business, consider variables like unemployment rates or holiday seasons.
Gather Data: Collect historical data for these external variables from reliable sources such as government databases, industry reports, or meteorological agencies. Ensure that the data is aligned with your target variable’s time frame and has a similar frequency (e.g., daily, monthly).
Preprocess Data: Cleanse and preprocess the external factor data to handle missing values or outliers. Align the timestamps with your primary time series dataset to ensure consistency.
Feature Engineering: Extract meaningful features from the external factor dataset that capture relevant patterns or relationships with the target variable. For example, you could create lagged variables or moving averages of economic indicators.
Merge Datasets: Combine the primary time series dataset with the external factor dataset based on their common timestamps. Ensure that the datasets are synchronized correctly to avoid any discrepancies.
Model Training: Train your machine learning model using the merged dataset that includes both the primary time series and external factors. Choose an appropriate algorithm, such as ARIMA, LSTM, or GBM, depending on your specific requirements.
Evaluation and Validation: Evaluate your model’s performance using appropriate evaluation metrics and validation techniques. Cross-validation can help assess how well your model generalizes to unseen data.
Benefits of Incorporating External Factors
Incorporating external factors into your time series forecasting model offers several benefits:
Improved Accuracy: By considering relevant external variables, you can capture additional information that may impact future outcomes, leading to more accurate predictions.
Better Insights: Incorporating external factors allows you to gain a deeper understanding of the underlying dynamics and relationships within your data, enabling more informed decision-making.
Enhanced Decision-Making: By accounting for external factors, you can make better-informed decisions based on a holistic view of various influencing variables rather than relying solely on historical data patterns.
Conclusion
Incorporating external factors such as economic indicators or weather data into your time series forecasting model can greatly enhance its predictive power and provide valuable insights for decision-making. By leveraging machine learning algorithms alongside relevant external variables, businesses and organizations can make more accurate forecasts and stay ahead in dynamic and ever-changing environments.
Remember to carefully select relevant external variables, preprocess the data appropriately, perform feature engineering, merge datasets effectively, and evaluate the model’s performance thoroughly. With these considerations in mind, you can unlock a deeper understanding of your time series data and make more informed predictions for better planning and decision-making.
Utilise automated machine learning tools to quickly build, evaluate, and optimise models without manual coding.
Utilize Automated Machine Learning Tools for Efficient Time Series Forecasting
Time series forecasting using machine learning algorithms has become a popular approach for businesses to predict future trends and make informed decisions. However, building accurate models traditionally required extensive manual coding and expertise. Thankfully, with the advent of automated machine learning tools, this process has become much more efficient and accessible.
Automated machine learning (AutoML) tools enable users to quickly build, evaluate, and optimize time series forecasting models without the need for extensive coding knowledge. These tools streamline the entire process by automating various steps, including data preprocessing, feature engineering, model selection, hyperparameter tuning, and evaluation.
One of the significant advantages of utilizing AutoML tools is their ability to handle complex tasks that would typically require domain expertise. These tools can automatically handle missing values, outliers, seasonality adjustments, and other data preprocessing tasks. They also have built-in feature engineering capabilities that can extract relevant features from the time series data without manual intervention.
Additionally, AutoML tools simplify model selection by automatically testing multiple algorithms and selecting the best-performing one based on predefined evaluation metrics. This eliminates the need for trial-and-error experimentation and reduces the time required to find an optimal model.
Hyperparameter tuning is another critical aspect of building accurate time series forecasting models. AutoML tools can automate this process by searching through different combinations of hyperparameters to find the best configuration for a given algorithm. This optimization helps improve model performance without manual intervention or exhaustive parameter tuning.
Furthermore, AutoML tools provide built-in evaluation metrics that assess model accuracy and performance on unseen data. These metrics allow users to compare different models easily and make informed decisions about which model to deploy.
By utilizing automated machine learning tools for time series forecasting, businesses can save significant amounts of time and resources while still achieving accurate predictions. These tools democratize machine learning by making it accessible to users with varying levels of technical expertise.
Whether you are a data scientist, a business analyst, or an executive looking to leverage time series forecasting, AutoML tools can be a valuable asset in your toolkit. They empower users to focus on interpreting and utilizing the results rather than spending excessive time on manual coding and model building.
In conclusion, automated machine learning tools have revolutionized the process of time series forecasting. By simplifying and automating various tasks involved in model building, evaluation, and optimization, these tools enable businesses to quickly generate accurate predictions without extensive manual coding. Embracing AutoML can unlock the full potential of time series forecasting for organizations across industries.
No Responses